Effect of NXN on Speed Ratings at Foot Locker Nationals
by Bill Meylan (TullyRunners ... December 19, 2017)
One common question surfaces when the cross country season approaches the NXN and Foot Locker regional and national races ... "Which race attracts the better runners (NXN or Foot Locker)?
The question is generic and subjective ... and depends on what is meant by "better runners" ... As expected, Opinions vary.
Since speed ratings are the main focus of TullyRunners during cross country season, I decided to take a quick empirical look at the speed ratings of the top finishing group at both NXN and Foot Locker Nationals ... The top 15 finishers at Foot Locker earn "All-American" status, so I decided to empirically evaluate of the top 15 finishers at both races.
Background Information
Foot Locker started as the "Kinney Nationals" in 1979 and 1980 at Balboa Park California on a different course than the current Foot Locker Balboa course.
Foot Locker (Kinney) moved to a course in Florida for 1981 and 1982.
Foot Locker returned to Balboa Park in 1983 (basically the same course as currently used) and ran there through 1996 ... Florida hosted the race during 1997-2001 ... Balboa Park has hosted the race since 2002.
First-time national TV coverage of Foot Locker on ESPN began 1985, the year Reuben Reina set the current Balboa Park course record (http://www.footlockercc.com/history/history.shtml).
NXN (NTN originally) started in 2004 as a teams only race.
NXN added individual runners and regional qualification in 2008.
NXN raced at Portland Meadows during 2004-2013 ... moved to Glendoveer Golf Course in 2014.
NXN (NTN) was televised on a delayed-basis in 2004 by FOX SportsNet.
The top California girl's team declined an invitation to compete in 2004 (Ventura).
Basic Methodology
I figured something simple and
understandable would be a good way to present some empirical data![]() ... So I averaged the speed ratings of the top 15 finishers at
both Foot Locker and NXN on a yearly basis and plotted the results on a
graph.
... So I averaged the speed ratings of the top 15 finishers at
both Foot Locker and NXN on a yearly basis and plotted the results on a
graph.
I was looking for trends in speed ratings at both races (speed ratings trending up or down).
I entered the evaluation with some suppositions (opinions):
I knew the national talent was being divided between Foot Locker, so I assumed NXN was having a negative effect on the Foot Locker speed ratings ... Since less talent was entering Foot Locker, I expected to see the speed ratings trending down, especially after individuals were added to the NXN field ... This evaluation was done to confirm or dismiss this assumption.
Some runners can run well at national races on back-to-back weekends, but not all ... I thought that might have a negative effect on some runners at Foot Locker ... Only a few runners have this opportunity (some South & Midwest runners), so it's probably a minor effect compared to missing talent.
I was not certain if a trend
would be visible at NXN ... but thought the switch from Portland
Meadows to Glendoveer might have an effect (e.g. talented runners
might be more willing to run at a soft (partly muddy) golf course
than the Portland Meadows mud swamp![]() ).
).
Overall national talent is expected to vary from year-to-year ... Some years will be better than others, and that must be considered when looking for trends.
Results & Conclusion
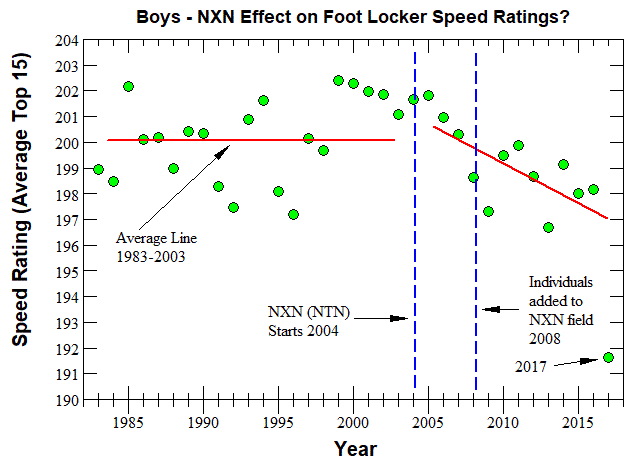
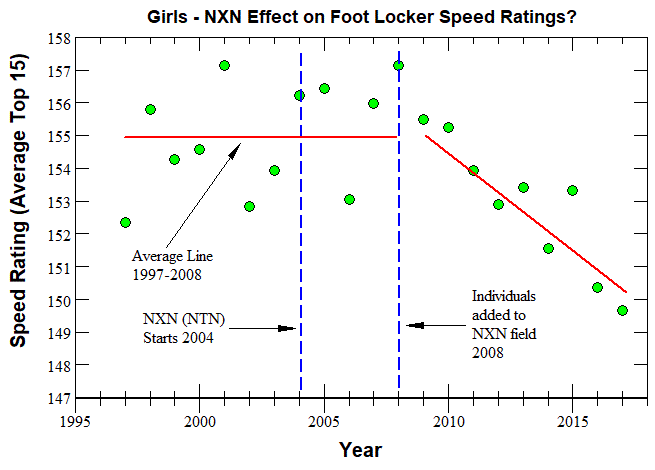
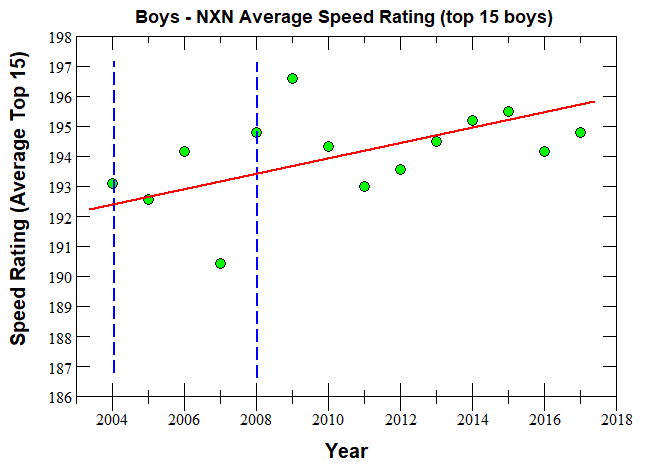
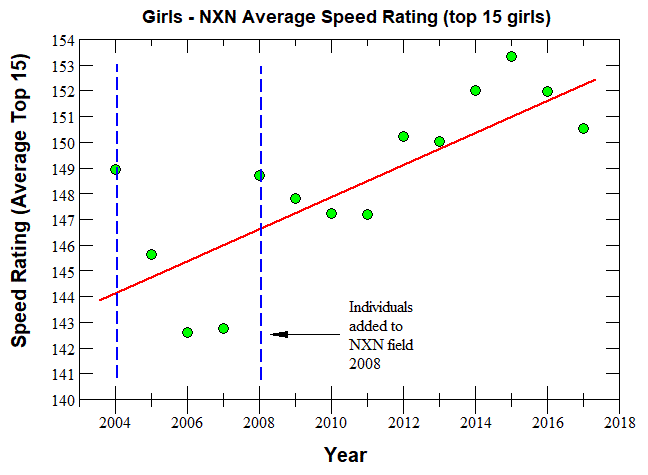
The four graphs below illustrate the speed ratings trends:
The speed ratings at Foot Locker are trending down, especially since individuals were added to the NXN fields.
The speed ratings at NXN have been trending up since individuals were added to the NXN fields (this was expected).
The average speed rating used here is a bit of a compromise, but it works for the intended purpose ... It must be noted that several very high or low ratings (in a group of 15 runners) can skew the average a bit.
The trends do not prove that NXN is the "effect" causing the lower average speed ratings at Foot Locker, but it is a possible contributing factor.
Graph 1 - Boys Average Speed Ratings at Foot Locker 1983- 2017

From Graph 1 ... The average speed rating for
some years during 1983 to the mid-1990s was relatively low ... The
biggest exception was 1985 when Reuben Reina set the
Balboa course record and a bunch of other guys ran exceptional fast
times ... I still get criticized for the speed ratings in 1985 because
some people think they should be higher![]() ... For the very few who might be interested, I wrote an article a
couple of years ago about "Footlocker
at Balboa Park - Relative Speed" ... In this average speed
rating exercise, I found out that 1985 had the highest median speed
rating for the top 15 finishers of all Foot Locker years (and 3rd highest
average speed rating ... Dathan Ritzenhein & friends helped the average in 1999 and
2000).
... For the very few who might be interested, I wrote an article a
couple of years ago about "Footlocker
at Balboa Park - Relative Speed" ... In this average speed
rating exercise, I found out that 1985 had the highest median speed
rating for the top 15 finishers of all Foot Locker years (and 3rd highest
average speed rating ... Dathan Ritzenhein & friends helped the average in 1999 and
2000).
The 2017 average speed rating was exceptional low ... I assume 2017 will be an outlier year and the average will go back up next year ... Perhaps poor air quality from nearby wild fires contributed to the low speed ratings in 2017.
Graph 2 - Girls Average Speed Ratings at Foot Locker 1997- 2017

From Graph 2 ... I limited the girls' graph range to illustrate the recent years ... The trend is obviously declining since individuals were added to the NXN races.
Graph 3 - Boys Average Speed Ratings at NXN 2004- 2017

From Graph 3 ... Slight trend upward for the Boys at NXN ... nothing spectacular, but the first few years at NXN had some very good team runners.
Graph 4 - Girls Average Speed Ratings at NXN 2004- 2017

From Graph 4 ... Noticeable upward trend in the average speed rating for the girls ... BUT note 2004 - the team field had multiple Foot Locker Finalists and it showed in the average speed rating.
Final Opinion ...
The speed ratings for Foot Locker & NXN were determined by common & consistent methodology ... Therefore, the trends illustrated in the graphs reflect what is happening at the two meets.
Dividing the talent between the two meets is expected to have an effect, and it does.
Even with the top talent divided, both meets are still exceptionally good.
A combined Foot Locker-NXN National Meet is an interesting idea ... But it is not possible to accomplish and preserve the character, feel and history of both meets.
Page Link - Data Used - Average & Median Speed Ratings for Top 15
Page Link - Foot Locker Speed Ratings 1997-2016