[Home Page]
Footlocker at Balboa Park - Relative Speeds
by
Bill Meylan (TullyRunners
... December 27, 2015)
Interest in course records is
apparent amongst runners, fans and media articles during the cross
country season. There was "buzz" entering Footlocker 2015
concerning Andrew Hunter's chances of breaking the Balboa Park record
set by Reuben Reina in 1985. That record had persisted for 30 years
despite the efforts of top elite talent from around the nation.
Questions were raised when I began
posting historical speed ratings for Footlocker and Reuben Reina's
course record did not have not have the top speed rating at Balboa Park
... Actually, a number of runners at Balboa have higher speed ratings
than the course record ... The top historical speed ratings at
Footlocker Nationals (for both Balboa Park and Orlando, FL) are
available from "Footlocker
Finals - Speed Rating History- Best since 1982".
Location & History of
Footlocker ... The Foot Locker Cross Country Championships were
formerly known as the Kinney Cross Country Championships until it
changed names in 1993 ... The Kinney Championship began in 1979 and was
run at Balboa Park in San Diego, CA ... At the first race in 1979,
competitors wore their own uniforms ... Regional races were scattered
over the calendar: Houston and New York (October), Chicago (November)
and San Francisco and Atlanta (December) ... But it started a
traditional that continues to present day ... For the first two years of
Kinney, 35 runners from five regions qualified for the boys and girls
races (regional sites were New York, Georgia, Texas, Kansas and
California) ... Additional history (plus results) are available at:
http://www.footlockercc.com/history/history.html
Footlocker-Kinney ran at Balboa Park
in 1979 and 1980 ... It switched to Orlando, FL in 1981 and 1982 ... It
returned to Balboa Park in 1983 through 1996 ... Footlocker ran in
Orlando, FL from 1997 to 2001 ... It returned to Balboa Park in 2002 to
present day (2015).
Speed Rating Years at Balboa
... I found some "questions" regarding changes at the Balboa course from
1979-1980 to the return in 1983 ... By 1983, the regional qualifying
process had been established ... The "event" was becoming known
nation-wide and top runners were competing ... So evaluating Footlocker
at Balboa Park from 1983 to present is the focus of this article.
The raw data used for the graphs at
statistics presented in this article are available from "Footlocker
at Balboa Park 1983 to 2015 (results with speed ratings)" ... This
includes raw data for both boys & girls.
Fastest Footlocker Boys at Balboa Park ... Sorting the raw
data yields the following top 42 race times at Footlocker Balboa since
1983 ... Some years there decimal fractions to the race times and other
years list only the "whole second" race times ... when I found different
results with both, I noticed sometimes the whole seconds were rounded
up, but truncated at other times (doesn't really matter this for
article) ... Side-Note: I got one timing company mad at me
when I asked "Why do you post XC times without the decimal fraction?
Is it because that's the best accuracy you have?" ... In future years, knowing the "tenth-of-a-second" shows who-beat-who.
 Boys Fastest Footlocker Times between 1983 and 2015 at Balboa Park

      Name                    Gr  Region        St       Time       Year         Speed Rating
  1   Reuben Reina            12    SO          TX      14:36.8     1985  **     208.7   209
  2   Marc Davis              12    W           CA      14:38.1     1986         211.3   211
  3   Chris Solinsky          12    Midwest     WI      14:40.5     2002         212.5   212
  4   Mark Mastalir           12    W           CA      14:41.3     1985  **     207.2   207
  5   Adam Goucher            12    MW          CO      14:41.7     1993         213.1   213
  6   Todd William            12    MW          MI      14:49.8     1986         207.4   207
  7   Bryan Dameworth         12    W           CA      14:49.9     1989         209.4   209
  8   Michael Fout            12    MW          IN      14:50       2007         210.3   210
  9   Scott Fry               12    MW          OH      14:50.0     1984         209.3   209
  10  Mark Dani               12    W           CA      14:50.9     1985  **     204.0   204
  11  Jonathan Hume           12    MW          CO      14:51.4     1985  **     203.9   204
  12  Edward Cheserek         11    NE          NJ      14:51.5     2011         209.8   210
  13  Futsum Zeinasellassie   12    MW          IN      14:52.1     2011         209.6   210
  14  Robert Henes            12    MW          OH      14:52.6     1985  **     203.5   203
  15  MebrahtorM Keflezighi   12    W           CA      14:53.0     1993         209.3   209
  16  Troy Maddux             12    MW          IL      14:53.2     1985  **     203.3   203
  17  Jon Hatley              12    MW          MO      14:53.3     1985  **     203.2   203
  18  Matt Giusto             12    W           CA      14:54.1     1983         206.0   206
  19  Marc Davis              11    W           CA      14:54.4     1985  **     202.9   203
  20  Matthew Withrow         12    Midwest     IL      14:55       2003         207.7   208
  21  Drew Hunter             12    South       VA      14:55.7     2015         206.4   206
  22  Eric Mastalir           12    W           CA      14:56.4     1985  **     202.2   202
  23T Galen Rupp              12    West        OR      14:57       2003         207.0   207
  23T Christopher Derrick     12    MW          IL      14:57       2007         208.0   208
  25  Shadrack Kiptoo         12    West        NM      14:58       2003         206.7   207
  26  Matt Downin             12    NE          NH      14:58.3     1994         206.6   207
  27  Lukas Verzbicas         12    MW          IL      14:59       2010         207.3   207
  28  Robert Kennedy          12    MW          OH      14:59.0     1987         206.3   206
  29  Edward Cheserek         12    NE          NJ      14:59.3     2012         206.9   207
  30  Andrew Maris            12    W           WA      15:00.9     1989         205.7   206
  31  Joshua McDougal         12    Northeast   NY      15:01       2003         205.7   206
  32  Wesley Smith            12    Midwest     OH      15:01.0     2002         205.7   206
  33T Benjamin True           12    Northeast   ME      15:02       2003         205.3   205
  33T Michael Coe             12    WE          CA      15:02       2005         207.0   207
  33T AJ Acosta               12    WE          CA      15:02       2005         207.0   207
  36  Grant Fisher            12    MW          MI      15:02.1     2014         205.3   205
  37  John Mortimer           12    NE          NH      15:03.1     1994         205.0   205
  38T Glenn Morgan            12    W           NM      15:03.3     1985  **     199.9   200
  38T Brian Grosso            12    MW          MI      15:03.3     1988         204.9   205
  40  Corey Ihmels            12    MW          ND      15:03.6     1991         207.8   208
  41  Eric Henry              12    SO          TX      15:03.9     1985  **     199.7   200
  42  John Long               12    MW          MN      15:04.4     1985  **     199.5   200

      Footlocker 1980 at Balboa - Same Course?? Unclear
  --  Jay Marden                    W           CA      14:53       1980
  --  Jon Butler                    W           CA      14:57       1980
  --  Marty Beauchamp               NE          NY      15:00       1980
  --  Timothy Hacker                MW          WI      15:03       1980
  --  Tom Ansberry                  W           AZ      15:04       1980
|
Since 1983, 977 boys have started and
finished the Footlocker race at Balboa Park ... As can be seen above, 9
of the top 22 race times occurred in 1985 (the year Reuben Reini set the
current course record) ... That raises red flags with respect to
the consistency of speed of the course over a period of years ... Obviously, Balboa ran exceptionally fast in 1985 ... It happens at
other courses as well ... The speed rating process evaluates and adjusts
accordingly ... It's not that big a deal to me
 ... But it does matter to people who place extra importance on course
records and the historical evaluation of the runner who set the course
record.
Some Graphical Depictions
... Similar to my Amber Trotter
Speed Rating article, I will use some graphs to illustrate the
relative speed of some Footlocker races in different years (and a final
graph at the very bottom which sums it up nicely).
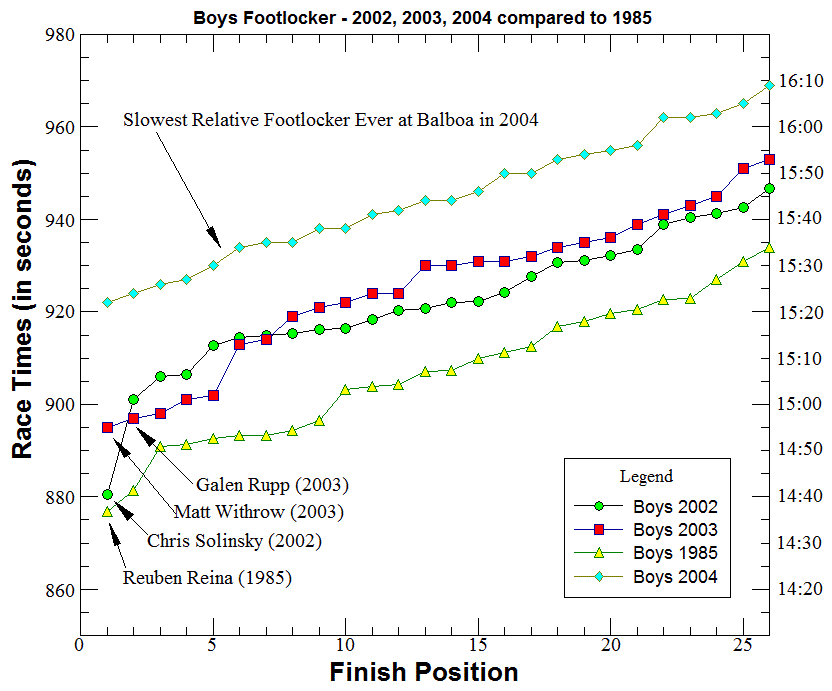
I will start by comparing 1985 to
2002, 2003 and 2004 ... Footlocker returned to Balboa in 2002 after 5
years In Orlando, FL ... I selected 2002 and 2003 because they fall near
the average-median speed of Footlocker Balboa and they pre-date the NXN
National race ... I selected 2004 because it had the slowest
relative speed of all Footlocker Balboa races (along with 1996).
Why Slow in 2004 ... A horse
racing acquaintance who was at Footlocker 2004 characterized the course
condition as "good", but not fast because it was wet and soft in enough
areas ... He was also told about some tree damage problems which cause
some minor re-routing that may have added a small amount of extra
distance ... The Footlocker web-site said it was unseasonable warm for
the girl's races ... A girl who ran in both 2003 and 2004 (Kate Niehaus)
noted "Although last year (2003) it had been warmer in San Diego than in
Columbia, South Carolina, this year (2004) it was a lot warmer, and the
course was muddier" (http://sc.milesplit.com/articles/4372).
Reasons why a course runs fast or
slow can be interesting, but I completely ignore all of that when
speed rating a race ... The comparison of final times determines my
evaluation ... The comparative graph below shows the slowness of the
2004 boy's race that was won by Kenneth Cormier over Andrew Bumbalough
and other top runners (15:22 slowest winning boy's time ever) ...
Aislinn Ryan (Warwick Valley HS, NY) won the girl's race in 17:31,
but had a speed rating of 168 (only 5 girls broke 18:00 in 2004 ...
Jenny Barringer Simpson finished 10th in 18:16).

The graph illustrates the relative
speed comparison very nicely ... The Balboa Park course ran much faster
in 1985 compared to 2002 and 2003 ... a quick visual comparison shows 15
to 20 seconds faster in 1985.
As noted above, 9 of the top 22 race
times at Balboa Park occurred in 1985 ... The people questioning my
speed rating for Reuben Reina in 1985 have offered the explanation that
the top 9 guys in 1985 were simply superior runners that had great
performances on that particular day ... That explanation has a couple of
problems with respect to speed rating.
First problem ... Finishers #10
through #26 in 1985 match-up consistently faster than the corresponding
runners in 2002-2004 ... Therefore, the explanation needs to be extended
to say "The entire field in 1985 is at least 15-20 seconds superior in
quality to the runners in the years shown above" ... Highly Unlikely
with the same qualifying procedure and national pool of runners .
.
Second problem ... There were two
races that day in 1985 ... Girls also raced ... Graphs of the Girl's
race also show the Balboa course running significantly faster for the
Girls in 1985 (example graph shown on the
Extra Data & Graphs web-page).
Bottom-Line ... The
Balboa course simply ran faster in 1985 than in other Footlocker years
... The reason does not matter for my speed rating purposes ...
The weather could have been perfect, the running surface superior to
other years, or maybe the runners ran through a time vortex .
.
Balboa ran noticeably slower in
2002 compared to 1985 ... Yet Chris Solinsky (2002) was only 3.7
seconds slower than Reuben Reina in 1985 ... That's why Chris
Solinsky's speed rating (212.5) is higher than Reuben Reina
(208.7).
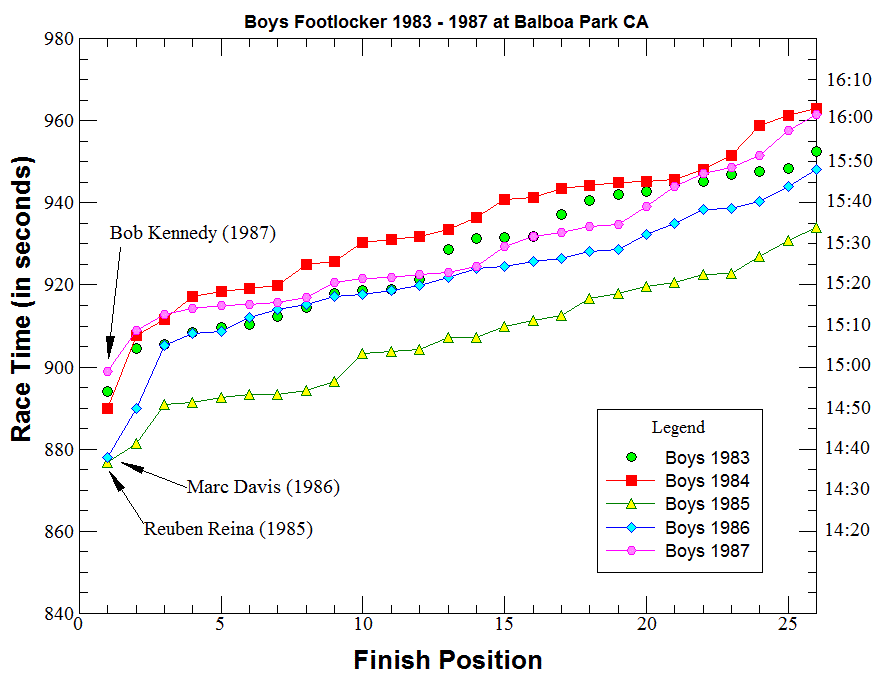
Looking at Years 1983-1987
... Checking the time-frame around 1985 to see if the other years were
nearly as fast as 1985 ... The graph plots the races two years before
and two years after 1985 for comparison to 1985 ... Again for
whatever reason, 1985 was significantly faster than 1983, 1984, 1986 and
1987 ... An explanation that the entire field in 1985 was significantly
superior in quality to the other years does not fly for the same reasons as
noted above.

Marc Davis (1986) has a higher speed rating
than Reuben Reina because speed ratings adjust for the relative
speed of each race.
Quality of Races ... This is an
important consideration in speed rating and direct comparison of races
... In general, if races have the same qualifying procedures,
time-frames, pool of runners and number of competitors, then direct
comparison becomes possible (this applies to Footlocker, State
Championship meets, NXN, etc.) ..... Quality can vary from year-to-year,
especially at the top-end with super-talented runners, and that's why
speed rating evaluates the whole field and selects appropriate "groups"
of runners for the determination ... Having data on individual runners
entering the race allows adjustment of seasonal-yearly variations of
quality (data such as speed ratings at qualifying races, State Meets,
etc).
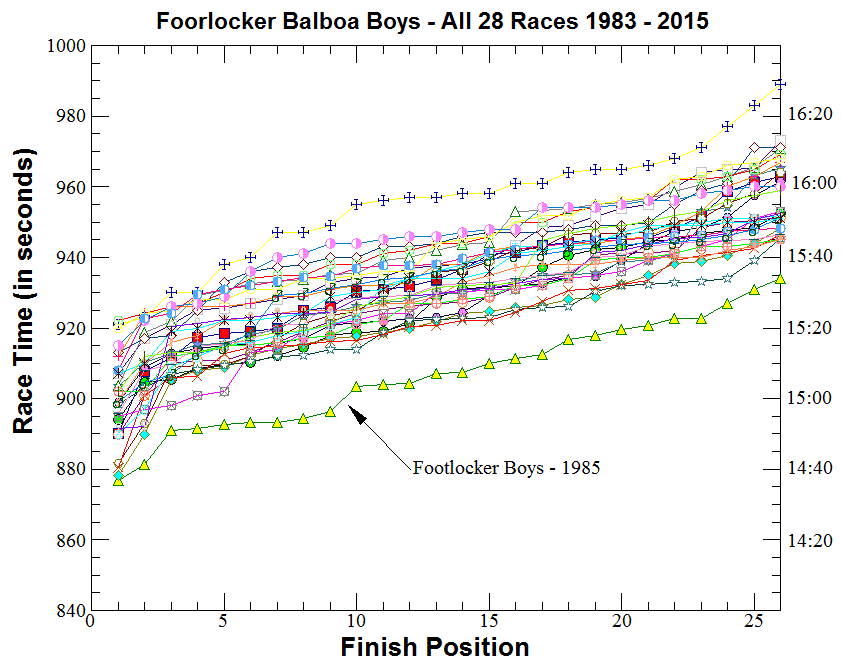
The relative speeds at Footlocker - Balboa Park have
varied from fast (1985) to slow (2004, 1996) with a variation on the order of
40+ seconds based on group comparisons ... However, most races fall in a middle section with some
consistency at times (see the graph below which "might" convince
some viewers that Footlocker 1985 was questionably fast).
In the 28 races of Footlocker at Balboa ...The
average winning time for the boys is 15:00 (whole number) ... The
average winning time for the girls is 17:11 (whole number).
Note -
Extra Data & Graphs web-page has a table and graphs concerning
the Footlocker girls at Balboa.
The graph below ... I plotted all 28
boy's Footlocker Balboa races on the same graph ... A statistician
might consider 1985 as an outlier .
.


