TullyRunners - Article
High National Speed Ratings from the Past
by Bill Meylan (July 15, 2015)
Recent inquiries prompted this article ... Since TullyRunners focuses on speed ratings for cross country, some viewers are asking about the highest speed ratings at the nation level in past years ... In particular, they are asking about the speed ratings for the following three performances:
...
Dathan Ritzenhein - at the Michigan State Meet 2000 (MI State
course record)
... German Fernandez - at the California State Meet 2007
(Woodward Park course record)
... Cathy Schiro - at the Kinney (Footlocker) Northeast Seeded Race
1984 (Van Cortland Park course record)
Followers of TullyRunners probably know that the speed ratings for the Footlocker National races are generally the highest speed ratings I have derived nationally ... Each year I post the historical Footlocker results with speed ratings (including the highest).
The following table lists my highest speed ratings from both Footlocker and other XC races (including the three performances mentioned above) ... Please Remember -The lists are limited to races I have evaluated ... and that excludes most non-Footlocker races prior to 2000.
For those
interested, this article also
discusses the method used to derive the speed rating for Dathan Ritzenhein's
Michigan State Meet record ... Plus some background information on Cathy
Schiro (see why she was capable of high speed ratings).
Boys Highest Speed Ratings From Footlocker Nationals ... (additional values at this link) Time Speed Rating (Year) -------- ------------ ------ Dathan Ritzenhein 12 Rockford MI 14:35 213.7 214 2000 Adam Goucher 12 Doherty CO 14:41.7 213.1 213 1993 Chris Solinsky 12 Stevens Point WI 14:40.5 212.5 212 2002 Dathan Ritzenhein 11 Rockford MI 14:29.83 211.7 212 1999 ** Orlando FL course record Marc Davis 12 San Diego CA 14:38.1 211.3 211 1986 Donald Sage 12 York HS IL 14:33.85 210.4 210 1999 Michael Fout (12) LaPorte H.S. IN 14:50 210.3 210 2007 Ian Dobson 12 Klamath Union OR 14:34.28 210.2 210 1999 Edward Cheserek 11 Newark NJ 14:51.5 209.8 210 2011 Futsum Zeinasellassie 12 Indianapolis IN 14:52.1 209.6 210 2011 Josh Rohatinsky 12 Prove UT 14:36.24 209.6 210 1999 Bryan Dameworth 12 Agoura CA 14:49.9 209.4 209 1989 MebrahtorM Keflezighi 12 San Diego CA 14:53.0 209.3 209 1993 Scott Fry 12 Sandusky OH 14:50.0 209.3 209 1984 Reuben Reina 12 John Jay TX 14:36.8 208.7 209 1985 ** Balboa Park course record Christopher Derrick (12) Neuqua Valley HS IL 14:57 208.0 208 2007 Matthew Withrow 12 Tinley Park IL 14:55 207.7 208 2003 From Races Other Than Footlocker Nationals Dathan Ritzenhein 12 Rockford HS MI 14:10.4 210.53 211 2000 - MI State Meet German Fernandez 12 Riverbank HS CA 14:24.0 209.00 209 2007 - CA State Meet Edward Cheserek 11 St. Benedict's NJ 14:53 208.3 208 2011 - NJ Shore Coaches (Holmdel Park) Joe Rosa 11 WW Plainsboro N NJ 14:56 208.3 208 2009 - NJ MOC (Holmdel Park) Matthew Withrow 12 Tinley Park IL 14:54.0 207.3** 207 2003 - Footlocker Midwest (Kenosha, WI) ** re-evaluated from 209 to 207; Matt Withrow then won Footlocker beating Galen Rupp, Josh McDougal, Ben True, Garrett Heath, Lopez Lomong and others. |
Girls Highest Speed Ratings From Footlocker Nationals ... (additional values at this link) Time Speed Rating (Year) -------- ------------ ------ Amber Trotter (12) Redwood Valley CA 16:24.07 180.3 180 (2001) ** Orlando FL course record Melody Fairchild 12 Boulder CO 16:39.2 177.9 178 (1990) ** Balboa Park course record Julia Stamps 10 Santa Rosa CA 16:41.9 173.0 173 (1994) Janet Smith 12 Edison NJ 16:43.7 170.4 170 (1983) Aisling Cuffe (12) Cornwall NY 16:53 170.3 170 (2010) Cathy Schiro 12 Dover NH 16:48.1 169.0 169 (1984) Jordan Hasay (9) Mission College CA 17:05 169.0 169 (2005) Erin Keogh 11 McLean VA 16:43.8 168.4 168 (1985) Aislinn Ryan (11) Warwick Valley NY 17:31 167.7 168 (2004) Erin Sullivan Mt. Mansfield VT 17:22.2 167.6 168 (1997) ERIN SULLIVAN 12 Mt. Mansfield VT 17:35.70 167.1 167 (1998) Erika Odlaug (12) Bannockburn IL 17:04.30 166.9 167 (2001) Sara Bei (12) Montgomery CA 16:55 166.7 167 (2000) Natasha Roetter (12) Lexington MA 17:05.14 166.6 167 (2001) From Races Other Than Footlocker Nationals Cathy Schiro 12 Dover NH 16:46 173.67 174 (1984) - Kinney Northeast (VCP record) Aislinn Ryan 11 Warwick Valley NY 16:56.31 168.2 168 (2004) - Great American ROC WakeMed,NC Aisling Cuffe 12 Cornwall NY 17:16.9 167.4 167 (2010) - NY Feds (Bowdoin Park record) Nicole Blood 11 Saratoga NY 17:27.3 166.9 167 (2004) - NY Federations (Bowdoin Park) Others for reference: Sarah Baxter 11 Simi Valley CA 16:00.0 166.0** 166 (2012) - Mt. SAC Invite course record Alexa Efraimson 11 Camas WA 16:50.1 165.3 165 (2013) - NXN Nationals (Portland Meadows) ** upper-limit evaluation (164 was originally derived and still acceptable) |
Why are the Footlocker
National Speed Ratings So High?? ... Footlocker Nationals is unique
... A small field of many of the best elite runners in the nation compete
head-to-head on a course that is generally in good (fast) condition with
good weather ... Runners come to run fast and win ... The best finishers often elevate
their performance level to new heights (by necessity to compete well) ...
and it is reflected in the speed ratings by the process I use to derive
Footlocker speed ratings ........ Analogies in track & field might be races
like the Arcadia Invitational 3200 meters, the Brooks PR Invitational, the adidas Dream Mile,
professional & college races and others where fast national track times occur due to
the nature of the race and the competition ... High school cross country has far fewer
opportunities, and Footlocker National stands out![]() .
.
German Fernandez and Cathy Schiro:
 Cathy Schiro with the 1984 Kinney National trophy |
German Fernandez ... set the
Woodward Park, CA State Meet course record in 2007 (14:24.0) ... I
posted the speed ratings for this meet back in 2007 (CA
State 2007 meet speed rating link) ... Upon re-evaluation, the
derived speed rating of 209.0 is accurate ... The Saugus Girls team
had excellent speed ratings (145, 144, 132, 132, 131, 130, 120) as
did Christine Babcock (159) and Jordan Hasay (158) ..... Clearly an
outstanding performance by German Fernandez who would go on to
finish 3rd at Footlocker Nationals behind Michael Fout and Chris
Derrick. Cathy Schiro ... Who is Cathy Schiro? ... She attended Dover High School in New Hampshire ... As a senior in April 1985, Cathy won the Penn Relays 3000 meter race with a time that still stands as the Penn Relays record (9:15.3) ... On May 12, 1984 of her junior year (at age 16), Cathy Schiro was the youngest runner in the 1984 Olympic Marathon Trials in Olympia, Wash (her first marathon) ... Her 9th-place finish (with a time of 2:34:24) still stands as the National High School Record in the Marathon ... That Olympic Trials race was won by Joan Benoit Samuelson (2:31.04 ... 3rd-place was 2:32.26) ... Cathy got to the Olympic Trials by winning the Avon Half Marathon in Central Park NYC (in Sept 1983) by more than 2 minutes over 1600 women runners with a record time of 1:13.19. Cathy Shiro competed in four Kinney (Footlocker) Nationals finishing 1st, 3rd, 10th and 19th in 1984, 1983, 1982 and 1981 respectively ... Cathy finished 3rd at Kinney Nationals in 1983 behind Janet Smith who is #4 on Footlocker speed rating table above with a 170 speed rating ... Note that Kinney Nationals would become Footlocker Nationals in later years ... As a senior in 1984, Cathy won Kinney (Footlocker) with a speed rating of 169.0. Cathy Schiro's time of 16:46 at the Kinney (Footlocker) Northeast regional still stands as the 5K record at Van Cortlandt Park in New York City ..... 3rd on the Van Cortlandt Park record list is Janet Smith (17:08.1 in 1983 ... Schiro finished 2nd in that race at 17:39.0 ... results currently at: http://footlockercc.com/northeast/results/ ). To derive Cathy Schiro's speed rating of 174 for the 1984 Van Cortlandt Park race, I used methods similar to that discussed below for Dathan Ritzenhein's State Meet race ... In the Northeast race, Cathy was only 1:20 slower than the Boy's winner John Trautman (who finished 2nd at Nationals) ... Link for the speed ratings and results for Kinney (Footlocker) Northeast 1984). I have written about Amber Trotter in the past and her incredible senior year in high school ... Melody Fairchild was another remarkable high school runner ... Cathy Schiro is number 3 on my highest all-time speed rating list ... These three women are at the top of my list for a reason ... They did something very special ... and knowing something about Cathy Schiro's performance background gives an insight into how special and talented she was in high school.
|
Dathan Ritzenhein & the Michigan State Meet 2000:
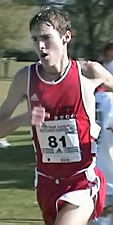
 Dathan Ritzenhein winning Footlocker 2000 in Orlando, FL |
The Michigan State Cross Country Meet (Lower
Peninsula) is contested at the Michigan International Speedway in
Brooklyn, MI ... It was run there in 2000 and every year through
2014 ... That consistency is helpful for my speed rating process. Results with speed ratings for the Michigan State Meet 2000 are posted on this link ...... Of interest, in addition to Dathan Ritzenhein's speed rating of 211, is the performance of the winning Rockford Boys & Girls teams ... The top five boys had speed ratings of 211, 187, 186, 185 and 169 ..... The top five girls had speed ratings of 143, 143, 142, 128 and 120 ... Both teams could be challengers at NXN Nationals with those ratings. Discussion of my speed rating process is given
below ... I expect it will be boring for most viewers, but
I'm including it for those who are interested ... and to show I
didn't simply make-up or guess Dathan Ritzenhein's speed rating of
211 at Michigan States 2000 |
Graphical Interpretation of Cross Country Results
My BS degree is in chemical engineering, and engineers use graphs and plots for all kinds of things ... My career as as an environmental scientist involves manipulation of large data sets of chemical and physical properties for various estimation techniques ... So I am comfortable with graphical solutions for data evaluation ... and I have applied some graphical techniques to evaluating high school cross country results.
Important Note about Data
Points ... Humans are not perfect![]() ... Not only are humans imperfect, human performance is variable; some more
variable than others
... Not only are humans imperfect, human performance is variable; some more
variable than others![]() ... So statistical (or subjective) results from imperfect-variable data
will never be perfect or precise ... BUT the results can be accurate
enough for the intended purpose ... That is the goal of speed ratings -
to measure the relative speed of runners at different races, different
venues and different dates with acceptable accuracy ... "relative" means
relative to all other runners.
... So statistical (or subjective) results from imperfect-variable data
will never be perfect or precise ... BUT the results can be accurate
enough for the intended purpose ... That is the goal of speed ratings -
to measure the relative speed of runners at different races, different
venues and different dates with acceptable accuracy ... "relative" means
relative to all other runners.
I graph the results of nearly all races I evaluate ... any anomalies become visible as does part the race profile itself ...... I maintain a library of race profiles for most races I evaluate ... a Race Profile includes:
... (1) the data points
(finishing position with corresponding race times and derived speed ratings)
... (2) the final race adjustment (or adjustment equation) used to make
the speed ratings
... (3) specific evaluation notes including the quality of the adjustment
All race evaluations are NOT equal in quality ... Some are just better than others ... some have low uncertainty and low margins of error ... some have high uncertainty and may be useless in future statistical application ... I use higher quality race profiles to help derive speed ratings whenever possible.
Michigan State Meet 2000 - Graphical Evaluation
In my speed rating process, the graphical profile of the Michigan State Meet 2000 needs to be compared to existing race profiles of known speed in my library so I can approximate a race adjustment for the 2000 State Meet based on known adjustments from other races ... Using just any race for comparison will NOT work ... Experience has shown that using races of approximate equal overall quality general works if applied properly, and that the best comparisons commonly come from the same race from previous years.
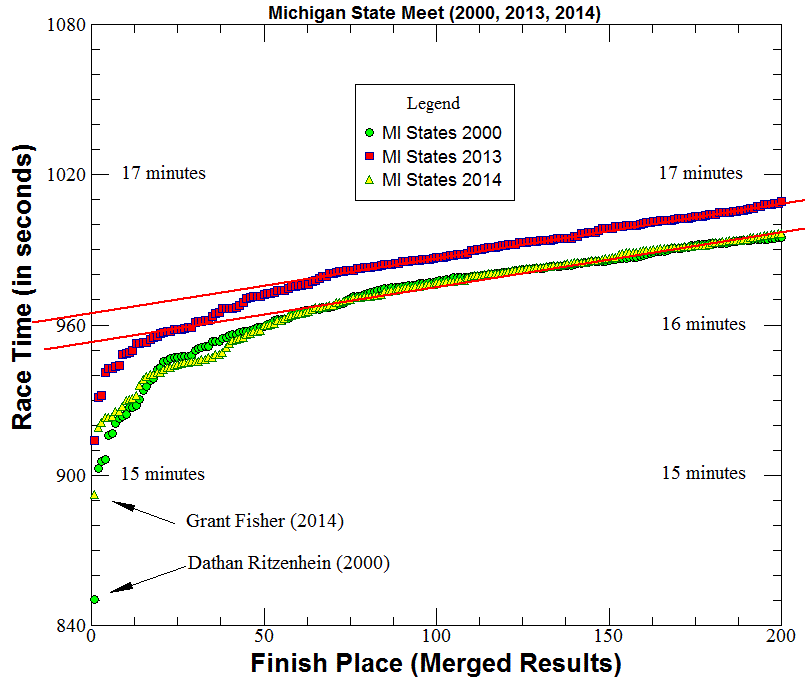
So my first choice for graphical evaluating the 2000 Michigan Boys States Meet is to compare it to other Michigan State Meets ... Michigan used four divisions at States in 2000 and are still using four divisions with approximately the same number of runners in each division ... this really helps in maintaining overall quality for my comparisons ... The graph below includes merged results from the Michigan State Meets in 2000, 2013 and 2014 for the top 200 runners:

The straight red lines are my eye-determined manual placement of time comparisons (that's how I do it) ... I devised my process to read the difference at the Y-axis based on population segments of the races ... As can be seen, the top runners are ignored ... Dathan Ritzenhein and Grant Fisher's speed rating is determined by how fast they ran relative to other runners, and NOT by how fast they ran relative to the course.
Michigan 2000 and Michigan 2014 look very similar in terms of speed ... only a single red-line is needed on the graph ... In contrast, the graph shows Michigan 2013 running about 9 seconds slower than Michigan 2014 (I like multiples of three since 3 seconds equals one speed rating point).
In addition to the merged results for both boys and girls, I also look at graphs of individual division races.
My race profiles for Michigan 2012, 2013 and 2014 have established race adjustments:
... Michigan Boys 2014 - 75
seconds
... Michigan Boys 2013 - 69 seconds
... Michigan Boys 2012 - 81 (maybe 84) seconds (with some uncertainty)
That is the amount of time I add to the actual final race times to determine the speed rating ... 2013 was about 6 seconds slower than 2014 ... and 2012 was 6 seconds faster than 2014 ... Note that the recent Michigan race adjustments above include a separate method of determination using known speed ratings of individual runners from a database and statistical correlation with final times ... I don't have that for Michigan 2000, so I'm relying strictly on a graphical solution with Michigan 2000 ... I looked at other years as well.
Overall - Michigan 2000 had a race adjustment of about 78 seconds (or it was about 3 seconds faster than 2014) ... If somebody wants to argue it was 3 seconds faster or slower than my number, I would not complain because it is well within any margin of error.
Comparing Michigan 2000 to Washington State 2014 and New York State 2014:
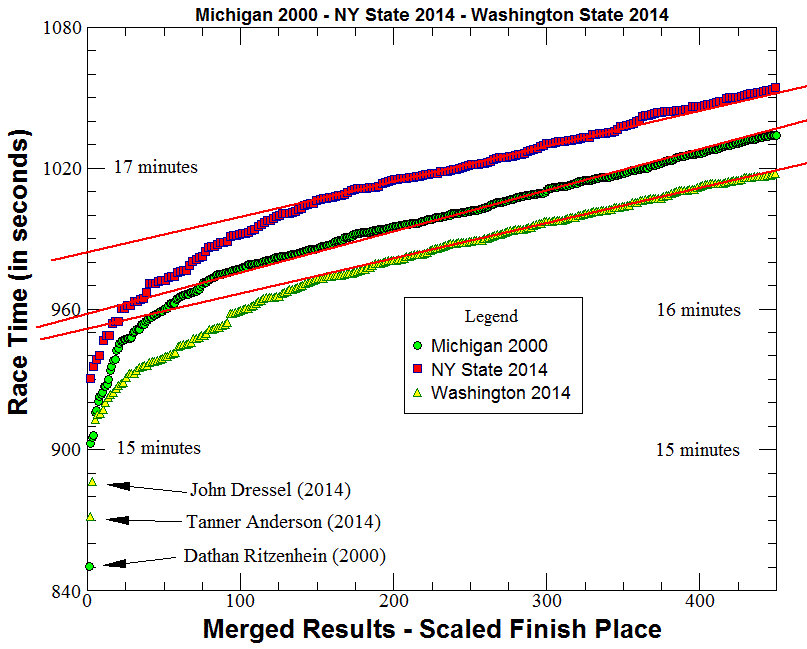
I also looked at other States ... I tried the New York State 2014 Meet because it uses four race divisions at States ... I also tried the Washington State Meet because I thought the Washington course might be a good comparison to the Michigan International Speedway (actual site of the Michigan State course) ... Here is the graphical comparison:

The Washington State 2014 Meet has a known race adjustment of 81 seconds (good quality) ... the graph above shows a difference of about 6 seconds between Michigan 2000 and Washington 2014 ... The overall quality of the Washington State Meet may be a bit higher than Michigan 2000 if the slopes of the red lines are appropriate (I excluded the lowest of 5 divisions in WA which could explain it) ... But it generally agrees with the race adjustment of 78 seconds for Michigan 2000 based on other Michigan State results.
The overall quality of New York State Meet can differ a bit from other States meets because its qualifying procedure ... The graph shows a difference of about 27 seconds slower than Michigan 2000 ... Again, nothing to contradict the race adjustment derived from other Michigan State results ..... I tried a number of other State Meet results as well including older results going back a number of years ... Bottom-Line - a Michigan State 2000 race adjustment of 78 seconds seems accurate enough for the intended purpose.
Important ... The graphical solution method I use requires experience ... Where to draw the red lines and believability of the solution is something I had to learn over time ... The examples above are fairly easy and straight-forward, but many early and mid-season races can be a challenge ... I decided not to post speed ratings for about two dozen out-of-State races last year because I knew the solution was too uncertain at the time.
I use three different methods to derive race
adjustments for speed ratings:
(1) Graphical solution (as demonstrated above)
(2) Statistical correlation with previous speed ratings ... Each
runner in a race has their prior speed ratings retrieved from a database,
and an overall prior speed rating for each runner is correlated with the
final times of the race to derive a race adjustment (This is the preferred
method when sufficient data are available).
(3) Historical knowledge of the relative speed of a specific race
course (as determined by 1 and 2 above) ... I rarely use this alone, and use
it more as check.
As said in previous years - "Only a crazy person would
spend the time doing what I do in high school cross country"![]() ... But deriving speed ratings for Dathan Ritzenhein and Cathy Schiro was an
interesting exercise
... But deriving speed ratings for Dathan Ritzenhein and Cathy Schiro was an
interesting exercise![]() ... and I actually believe the results
... and I actually believe the results![]() .
.