Footlocker & NXN 2019 - Some Speed Rating Data & Thoughts
Bill Meylan ... (December 22, 2019)
I get inquiries every year about the speed ratings for NXN and Foot Locker Nationals ... This year brought more than normal inquiries and comments due primarily to the 169.0 speed rating for Zofia Dudek at Foot Locker ... This did not surprise me, but some of the comments did.
My biggest surprise was two perennial
skeptics who grudgingly admitted that "Meylan's inflated Foot Locker speed
ratings might actually be close for once (and only once)"![]() ... My explanation of speed ratings and power-of-persuasion had nothing to do
with it
... My explanation of speed ratings and power-of-persuasion had nothing to do
with it![]() ...
Three girls running sub-17:00 on the Balboa course (Dudek running
16:45.0) was a piece of evidence they accept and could not ignore or explain
away ... A small glimmer of belief in the speed ratings due to absolute race
times on a specific course ... and my speed rating process of relative times ignores
course-record type data when
deriving speed ratings
...
Three girls running sub-17:00 on the Balboa course (Dudek running
16:45.0) was a piece of evidence they accept and could not ignore or explain
away ... A small glimmer of belief in the speed ratings due to absolute race
times on a specific course ... and my speed rating process of relative times ignores
course-record type data when
deriving speed ratings![]()
![]() ... There will always be skeptics and that is a good thing
... There will always be skeptics and that is a good thing![]() .
.
Meylan's Opinion:
NXN and Foot Locker Nationals are two highest quality XC races of the season by far
The races are different ...
... NXN has 200+ runners per race
... Foot Locker has only 40 runners per race
... The race conditions and weather are typically very different at Glendoveer Golf Course and Balboa Park
Which race may be "better" than the
other doesn't really matter![]() .
.
Comparing NXN and Foot Locker 2019
Below is a table listing the 18 runners that competed in both NXN and Foot Locker 2019 (10 boys and 8 girls) ... 22.5% of the Foot Locker field was comprised of runners that ran at NXN Nationals ... that's a decent percentage considering that many runners don't have the opportunity of competing at both NXN and Foot Locker regional races ... NXN's individual At-Large bids did help.
The table shows the respective NXN and Foot Locker speed ratings and finish positions with season-best and 2nd-season best speed rating ... The table highlights the runners who had speed ratings that varied by 4 or more points between NXN and Foot Locker.
Four boys have better highlighted speed ratings at NXN and four have better highlighted speed ratings at Foot Locker ... two boys were within one speed rating point at both races ... the 4 guys who raced better at Foot Locker all finished in the top 9 places at Foot Locker, while at NXN they finished 24th, 26th, 33rd and 44th ... their 2nd-best seasonal speed ratings indicate their Foot Locker ratings were not major deviations from expected potential ... Nothing that suggests inflated Foot Locker speed ratings versus NXN.
For the girls, 2 of the 8 girls have speed ratings equal or within 2 points at both races ... 2 have higher highlighted races at NXN and 4 have higher highlighted races at Foot Locker ... Katelynne Hart is an outlier in this regard (an off race at NXN), and her seasonal-best speed rating (159.37) occurred at NXN Midwest (and not Foot Locker which was 159.20) ... Riley Stewart had several seasonal speed ratings higher than her Foot Locker rating.
Of the 18 data points, Marlee Starliper's
168 rating at Foot Locker is the only data point that suggests any potential of
inflated ratings at Foot Locker, and she did have a 163 speed rating at Foot
Locker Northeast ... Overall, this comparison simply indicates that Marlee
Starliper had an excellent season-best performance at Foot Locker, and as one of
the skeptics noted, "her 16:46.8 time speaks for itself"![]() .
.
| Runners That Ran Both NXN & Foot Locker | ||||||
| Season | Season | |||||
| NXN | Foot Locker | Best | 2nd-Best | |||
| Boys | NXN | Speed | Speed | FL | Speed | Speed |
| Place | Rating | Rating | Place | Rating | Rating | |
| Josh Methner | 2 | 200 | 201 | 1 | 201 | 200 |
| Liam Murphy | 8 | 198 | 186 | 25 | 198 | 198 |
| Jack Spamer | 17 | 194 | 190 | 19 | 194 | 192 |
| Bob Liking | 19 | 192 | 186 | 24 | 192 | 192 |
| Kevin Antczak | 24 | 190 | 196 | 8 | 196 | 194 |
| Judson Greer | 26 | 190 | 197 | 5 | 197 | 194 |
| Evan Bishop | 33 | 189 | 196 | 6 | 196 | 193 |
| Brendan Favazza | 39 | 188 | 189 | 20 | 192 | 192 |
| Jack Jennings | 44 | 187 | 194 | 9 | 199 | 194 |
| Michael Hancock | 48 | 185 | 180 | 32 | 193 | 189 |
| Girls | ||||||
| Taylor Ewert | 2 | 163 | 159 | 6 | 163 | 159 |
| Marlee Starliper | 5 | 157 | 168 | 2 | 168 | 163 |
| Annalyssa Crain | 16 | 149 | 149 | 12 | 149 | 149 |
| Tatum David | 17 | 149 | 151 | 10 | 153 | 152 |
| Kelsey Harrington | 20 | 148 | 143 | 21 | 151 | 151 |
| Analee Weaver | 29 | 143 | 147 | 14 | 147 | 143 |
| Riley Stewart | 31 | 141 | 145 | 17 | 152 | 149 |
| Katelynne Hart | 50 | 134 | 159 | 4 | 159 | 159 |
Speed Adjustment Comparison for NXN and Foot Locker 2019
One common inquiry involves my race adjustment for calculating the NXN and Foot Locker speed ratings.
Biggest inquiry this year was about the
cold rainy conditions at NXN with the boys racing first and messing up the
course for girls ... One email said the course was in awful condition after the
boy's race and getting worse with continuing rain![]() .
.
Deteriorating muddy, slippery, sloppy conditions is difficult for both the runners and anybody deriving the speed ratings ... Under normal dry average conditions, the speed rating adjustments are derived separately but in conjunction with both the boy's and girl's races to yield final speed ratings that consider both races together ... Deteriorating conditions require total separation and independent adjustments.
Quick answer to a common inquiry -
By my calculations, the Glendoveer course ran 21 seconds slower for the girls
compared to the boys ... Yes, it does make a difference who runs first on
these types of courses![]() ... So Katelyn Tuohy's winning time of 17:18.4 was equivalent to a time of
16:57.4 in the boy's race ... and this can be seen from the
NXN speed ratings ....
(my
Foot Locker speed ratings at this
link).
... So Katelyn Tuohy's winning time of 17:18.4 was equivalent to a time of
16:57.4 in the boy's race ... and this can be seen from the
NXN speed ratings ....
(my
Foot Locker speed ratings at this
link).
Graphical Profile Comparison - Boys NXN and Foot Locker
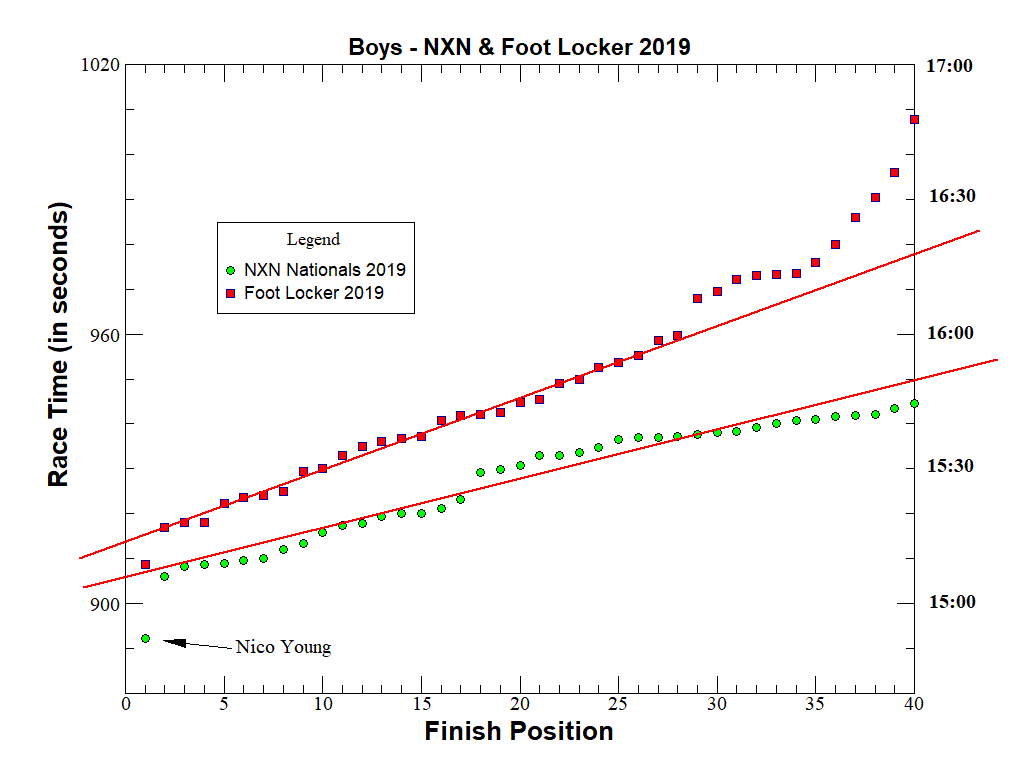
I love graphic illustration at data ... The graph below plots the raw data from the Boy's NXN and Foot Locker races for the top 40 finishers (meaning all Foot Locker runners and just the top 40 from NXN).
Some things to consider:
10 guys ran both races ... or 25% are common runners between both races
Common runners suggest some correlation between the two races
It's obvious that the NXN course ran
faster than the Foot Locker Balboa course for the boys ... I'm sure that
surprises some viewers due to the cold wet conditions at NXN ... But the
final times show the difference when graphed![]() .
.
In typical Foot Locker form, the back 1/3 or 1/4 of the field ran increasing slower than the rest of the field (so they mostly get ignored when deriving the speed ratings)
NXN had 203 total runners, so a significant drop-off in speed is not expected through just 40 runners
Nico Young gapped the NXN field ... and the graph shows it very nicely
The NXN correlation straight-line has a lower slope than the corresponding Foot Locker straight-line ... For this quality of race, this usually occurs for two reasons, (1) the race was run on a faster course and (2) the performance (and possibly overall quality) was a bit higher than the other race

The relative speed difference between the two races is read at the Y-axis (directly above the 900 second race time label because that is the convergence point) ... the difference is about 6 seconds ... meaning that, despite the slippery conditions, the overall speed of the NXN course was 6 seconds faster than the Balboa course in 2019 ... So Nico Young's NXN time of 14:52.3 would be equivalent to a time of 14:58.3 at the Balboa race.
The inherent speed of the Foot Locker Balboa course under fast conditions in recent years is fairly consistent ... for my speed rating adjustments, the Balboa course for the boys was negative 48 seconds (meaning I add 48 seconds to the actual race times to calculate the speed ratings) ... the Boy's Glendoveer course adjustment was negative 54 seconds.
I would love to tell you the inherent
speed of the Glendoveer course under good dry weather conditions, but who
the heck knows![]() ???
???
Side-Note ... the Balboa course is not a fast 5K course ... It runs similar to the Holmdel NJ course (when Holmdel runs fast), and remember that Katelyn Tuohy ran 16:21.0 there in 2018 (for a 177 speed rating when the race adjustment was negative 51 seconds) ..... Woodward Park had a race adjustment of negative 87 seconds at the California State Meet in 2019, so Nico Young's NXN performance was equivalent to Woodward Park race time of 14:19.3 at the CA State Meet.
Other Important Side-Note ...
The Foot Locker race had not yet occurred when I speed-rated NXN ... But when I
speed-rated Foot Locker, I did include the NXN race as one of five races for
graphical profile matching (with 4 previous Foot Locker races) ... This gave me
the approximate race adjustment used as the starting point to iterate the
individual runner seasonal speed ratings to find the convergence point from that
data which agreed with the graphical solution![]() .
.
And for those interested in the technical aspects of speed rating, I have never published a description of my individual runner seasonal speed rating iteration method ... That may appear in the coming months ... But for those able to identify and exclude outlier data, you can probably do it already without any help from me ... Various methods could reproduce the same results ... And there are some coaches in NY quite adept at just looking at race results knowing the previous speed ratings of some of the runners and coming up with the approximate speed ratings for the race in question ... I simply do a more complete analysis using databases and some adapted stat methods.
Graphical Profile Comparison - Girls NXN and Foot Locker
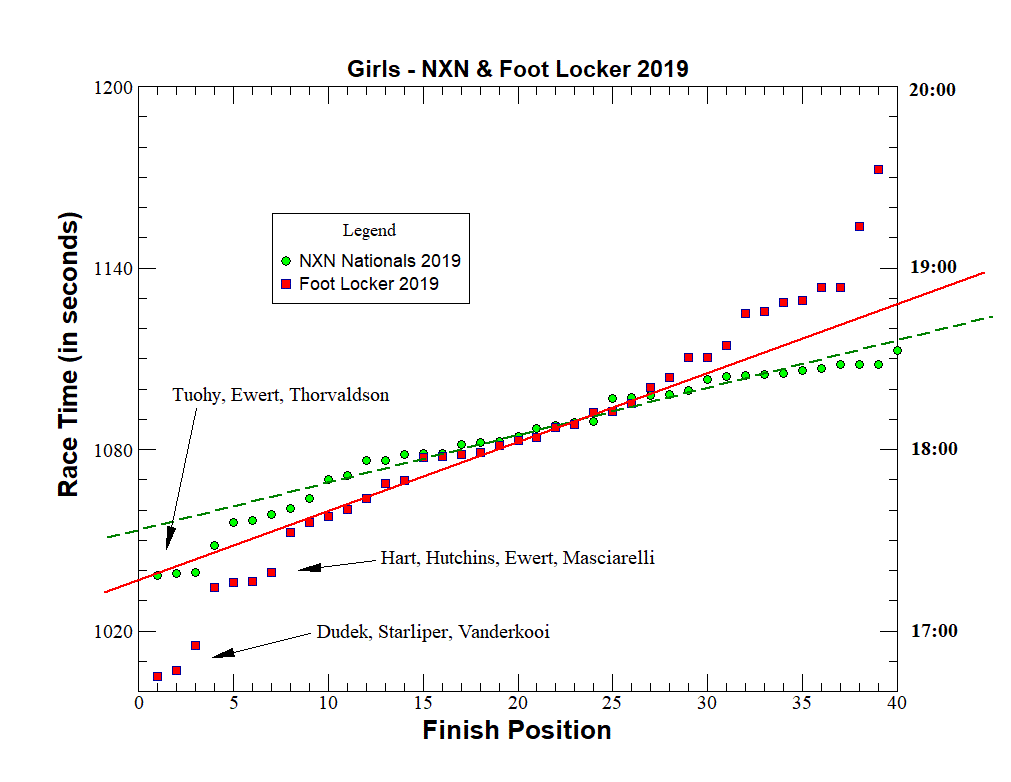
The graph below plots the raw data from the Girl's NXN and Foot Locker races for the top 40 finishers (meaning all Foot Locker runners and just the top 40 from NXN).
Some things to consider:
The NXN course was torn-up by the boy's race that preceded the girl's race
Continual rain between the two NXN races made the course even worse for the girls
As noted above, I calculated the NXN course ran 21 seconds slower for the girls compared to the boys due to the deteriorating conditions
Similar to the boys (and similar to many previous Foot Locker races), the back 1/3 or 1/4 of the field ran increasing slower than the rest of the field (so they mostly get ignored when deriving the speed ratings)
NXN had 201 total runners, so a drop-off in speed is not expected through just 40 runners (clearly illustrated by the graph)
The graph slope lines suggest the overall performance quality through 40 runners was generally better at NXN
The difference between the two straight correlation lines is about 15 seconds
An adjusted graph is shown below this graph that better illustrates the NXN vs. Foot Locker comparison

My final race adjustments for the girls were negative 33 seconds at NXN and negative 48 seconds at Foot Locker (boy's Foot Locker came out exactly the same as the girl's) ... This means the NXN course ran 15 seconds slower for the girls than than the Foot Locker course as illustrated above.
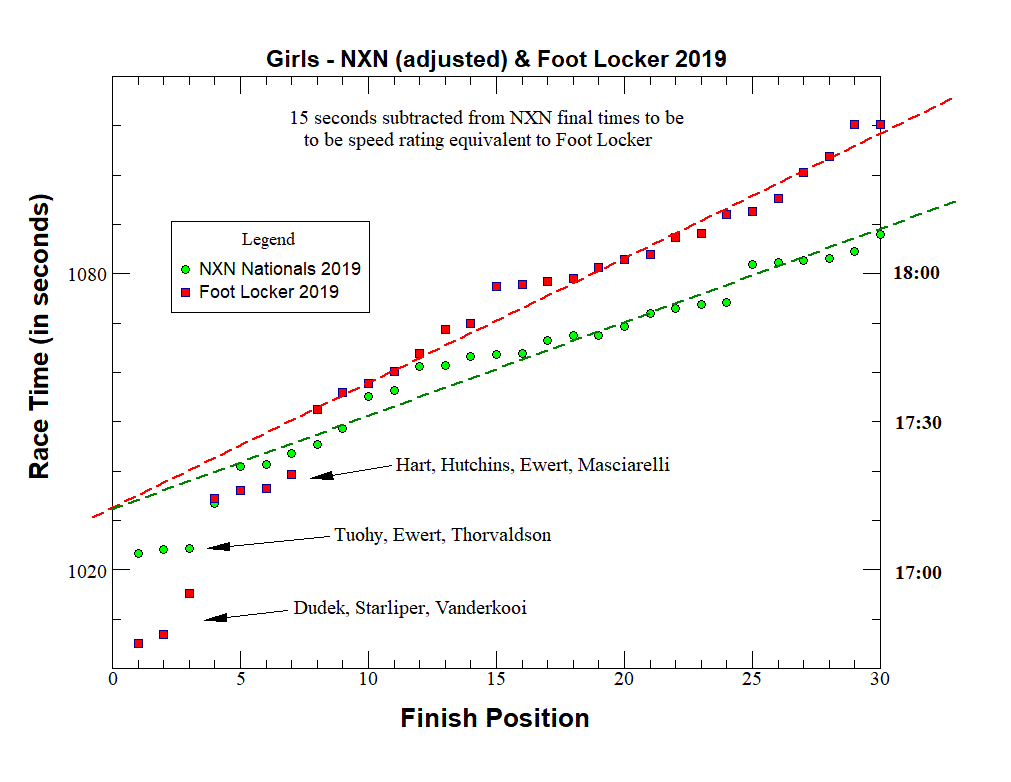
The graph below adjusts the NXN times by
subtracting 15 seconds to approximate equivalency with Foot Locker and
excludes the slower 25% of Foot Locker runners ... This makes the
correlation easier to see![]() .
.
Consider:
The straight-dashed correlation lines converge to zero difference at the Y-axis indicating the 15 second adjustment is real and a decent approximation
The overall performance quality of finishers #8 through #30 is generally superior at NXN Nationals.
The overall performance quality of finishers #1 through #3 is better at Foot Locker
The overall performance quality of finishers #4 through #7 is close
Foot Locker shows two groups of runners with field separation ... Dudek, Starliper, Vanderkooi and Hart, Hutchins, Ewert, Masciarelli
NXN shows one major group of runners with field separation ... Tuohy, Ewert, Thorvaldson

The reason for the higher speed ratings of the top three runners at Foot Locker is evident from the graph.
Random Thoughts
Katelyn Tuohy's win at NXN was one of
the most impressive efforts I have ever seen![]() ... and this comes from a long time horse handicapper
... and this comes from a long time horse handicapper![]() ... Horse handicappers are very familiar with the term "Class" ... it's
an important handicapping factor ... it is difficult to define in words.
... Horse handicappers are very familiar with the term "Class" ... it's
an important handicapping factor ... it is difficult to define in words.
Coming up the final hill to the finish-line
at NXN, Kateyln Tuohy had been caught by Sydney Thorvaldson and
Taylor Ewert ... Tuohy looked exhausted and beaten ... But in the final
stretch run the "Class" in Kateyln Tuohy summoned an invisible
energy and will-to-win that refuses to lose to runners she would normally beat
handily ... and Kateyln Tuohy hung on to win despite an off performance
... Sometimes a near loss or loss demonstrates the remarkable ability of an
exceptional athlete![]() .
.
===================
Track Bias ... Track Bias is another important important factor in horse handicapping ... Sometimes horses running at or near the front-end of a race have an advantage ... Sometimes closers have an advantage ... For example, the inside rail position at a track might be "more packed down and firmer" than other locations on the track and horses making the lead on the inside have an advantage because other horses have to move to the outside into the deeper and slower soil in order to pass.
The course conditions at NXN 2019 were conducive for a front-end bias advantage ... Wet, soft, muddy, slippery, sloppy conditions ... In my opinion, teams and runners "forwardly-placed" had an advantage ... Runners up front were better able to see and navigate to the potentially better footing locations.
The course was continually deteriorating
... and that means that runners in the same race were subjected to deteriorated
conditions created by runners in front of them![]() .
.
Just an opinionated generality:
In conditions like NXN 2019, light-footed light runners seem to race better than other runners (in general)
For example, Taylor Ewert said in an interview she was good in the NXN conditions
For example, the forwardly-placed
Saratoga Girls raced extremely well![]() .
.
To clarify ... I think the Saratoga Girls won by the margin they did was because:
They raced in front of other teams from the start
The conditions were favorable for most of their runners
Important - Saratoga entered the race 7 runners deep (all above a 120 speed rating level)
Five of the runners raced at or above projected levels ... Team depth really helps
Other potential podium teams that were only five runners deep (e.g. FM and North Central) were hurt in the scoring when typical scorers did not have a great race in the course conditions
That's enough Random Thoughts for now![]()
![]() .
.