| Speed Ratings for the Arcadia Invite Track 3200m 2026 |
... posted April 16, 2026
Arcadia Track Invitational 2026
... April 10-11, 2026 - Arcadia High School - Arcadia, CA
https://ca.milesplit.com/meets/731329-arcadia-invitational-2026/results
Note: The Speed Ratings were approximated considering three data set comparisons:
(1) Converting the actual 3200 meter times to approximated 5K times using a conversion factor of 1.67 ... a range of conversion factors will yield the same results for this exercise, but I decided on 1.67 because the 5K approximations fall within the range of common XC times at the Woodward Park XC course in California (and many California runners were in the Arcadia 3200m races).
Typically, my initial speed rating comparison during the XC season involves comparing the current XC race to previous XC races where the overall quality of runners is similar (does not have to be exact, just close enough) ... Generally, the same race from previous years works good enough as long as the speed corrections from previous years are decent ... For this initial speed rating correction approximation, I decided to try using ("test") the most recent NXN National XC races because a fair number of the same runners in the Arcadia 3200m races actually raced at NXN Nationals.
A Graph of the Boys Arcadia 3200m (using the 5K converted times) with the NXN National times and the corresponding finish positions is shown below ... This direct comparison worked out quite nicely (better than I expected) in generating an initial approximation for a speed rating correction (brief description also posted below).
(2) Next, the converted Arcadia 5K times (and time differences between runners) are "fitted" to the sequential XC season speed ratings of each runner to derive a separate speed rating correction based on these data points ... In actual practice during the XC season, I start with the approximated speed rating correction from the graph method noted above and generate temporary speed ratings for each runner assuming those numbers are decent enough ... I use an iterative "fitting" process for the sequential speed ratings and starting with a good initial estimate speeds up the process.
This method is what speed rating is meant to be
... Taking the known speed ratings of individual runners (or horses![]() )
and fitting them against each other on a relative basis ..... I have never
described my overall fitting process which includes a method of excluding,
including and approximating values for enough individual runners to make it
"good enough" for betting purposes on upcoming races.
)
and fitting them against each other on a relative basis ..... I have never
described my overall fitting process which includes a method of excluding,
including and approximating values for enough individual runners to make it
"good enough" for betting purposes on upcoming races.
When the graph method and sequential known speed rating method yield roughly the same speed rating correction it helps with the accuracy certainty ... and when this also agrees with the range of historically known speed rating corrections at a particular XC course, this is also usually good.
(3) Estimating a speed rating correction factor based on historical data fitting of 5000 meter track times to XC speed ratings.
My most recent
Table of XC Speed
Ratings with Approximated Times for Various Track Distances is posted at this
associated link ... It was posted back in December 2021, and could likely by
updated ... But even with additional updating, the numbers will still be very
variable (because runners overall are randomly variable and always will be![]() ).
).
The Arcadia Invitational yields exceptionally fast 3200 meter times ... so some corresponding speed ratings from the table above are expected to be a bit too high for some runners ... But overall, the table estimates can yield some helpful approximations.
AS USUAL, the Speed Ratings posted below are best-guess approximations ... But I believe they are very decent approximations.
Speed Ratings measure how fast runners run relative to other runners and groups of runners (Time Differences between runners and groups of runners) ... The numbers below are decent statistical fits.
| BOYS Combined 3200 Meter Track Races - Estimated Speed Ratings |
Boys Merged 3200 Meters Actual
3200m Estimated Estimated 2025 XC Season Speed Ratings
Pl Name Gr School Time 5K Time Speed Rating (sequential order - most recent first)
================================================================== -------- -------- ------------ ----------------------------------------
1 Jackson Spencer 12 Herriman 08:31.80 14:14.7 204.10 204 203 203 196 199 201 194 193 192
2 Marcelo Mantecon 11 Belen Jesuit Preparatory School 08:35.33 14:20.6 202.13 202 203 201 192 193 194 192 185 190
3 Oliver Horton 11 Coronado 08:38.95 14:26.6 200.13 200 195 193 198 199 195 195 196
4 Grady Lenn 12 De Pere 08:39.62 14:27.8 199.73 200 192 193 193 190
5 Brooks Barbee 11 Christ School 08:40.79 14:29.7 199.10 199 165 183 188 179 183 182 173
6 Brian Burns 12 Bentonville 08:41.38 14:30.7 198.77 199 192 195 193 182 184 182 177
7 Quinn Sullivan 11 Niwot 08:41.68 14:31.2 198.60 199 200 195 189 173 179 189 186 168
8 Maximo Zavaleta 11 ML King (SS) 08:43.21 14:33.8 197.73 198 189 188 187 185 192 186
9 Yohanes Van Meerten 11 Flagstaff 08:43.67 14:34.5 197.50 198 200 202 195 198 201 194
10 Malachi Schoenherr 12 Sheldon 08:43.93 14:35.0 197.33 197 178 186 189 189 186 181
11 Hunter Robbie 12 Niwot 08:45.20 14:37.1 196.63 197 199 195 192 186 182 188 187 176
12 Jay McDonald 11 Summit 08:45.46 14:37.5 196.50 197 190 192 178 189 187 182
13 Benjamin Berman 12 Bronx HS Of Science 08:45.85 14:38.2 196.27 196 185 175 187 189 190 190
14 Isaac Benjamin 12 South Kitsap 08:47.19 14:40.4 195.53 196 186 189 178
15 Ryder Keeton 12 Niwot 08:47.45 14:40.8 195.40 195 188 187 187 183 179 183 182
16 Asher Oates 12 Independence 08:47.82 14:41.5 195.17 195 189 181 186 188 190 188 190
17 Ben Lee 12 ThunderRidge 08:47.89 14:41.6 195.13 195 186 193 186 185 184 178 162 144
18 Gavin Schmitt 11 Christian Brothers Academy 08:47.96 14:41.7 195.10 195 190 194 189 188 185 182
1 Mikah Peters 12 Brandon Valley 08:48.66 14:42.9 194.70 195 188 167 191 186 191 188 190
19 Luke Hnatt 12 Christian Brothers Academy 08:48.91 14:43.3 194.57 195 193 195 190 189 188
20 Jack McGovern 10 Rockhurst 08:49.10 14:43.6 194.47 194 193 192 187 196
2 Aidan Neal 12 Alta 08:49.28 14:43.9 194.37 194 182 176 172 177 168 180 171 176
21 Clayton Jero 10 Summit 08:49.47 14:44.2 194.27 194 174 173 173 178 177 172
22 Wyatt Dann 10 Castle View 08:50.37 14:45.7 193.77 194 194 188 186 179 182 183 181 152
3 Owen Thiel 12 Glacier 08:50.57 14:46.1 193.63 194 165 182 185
23 Cooper Stream 11 Vacaville (SJ) 08:50.62 14:46.1 193.63 194 169 190 184 184 184
4 Bjorn Blankenship 11 Summit 08:51.06 14:46.9 193.37 193 189 189 181 182 183 181
24 Ryan Sykes 11 Horace Greeley 08:51.52 14:47.6 193.13 193 184 184 191 192 189 187
5 Mario Montoya 10 Redondo Union (SS) 08:51.63 14:47.8 193.07 193 180 187 182 187 188 180 180
25 Garrett Faught 10 Crater 08:51.94 14:48.3 192.90 193 191 193 190 178 171
26 Nicholas Ponte 12 ABQ Academy 08:52.94 14:50.0 192.33 192 185 184 183
27 Kellen Williams 12 Jesuit 08:53.20 14:50.4 192.20 192 183 190 186 184 177 183
6 Krish Desai 12 Mira Costa (SS) 08:53.74 14:51.3 191.90 192 188 182 176 182 185 178 179
28 Edward Stout 12 Taylorsville 08:53.83 14:51.5 191.83 192 186 177 172 164 172
7 Olly O'Connor 12 Viewpoint (SS) 08:54.21 14:52.1 191.63 192 188 182 190 191 186 167
29 Brennan Robin 11 Parkway 08:54.28 14:52.2 191.60 192 180 182
8 Maxwell Friedrich 12 St. Ignatius 08:55.13 14:53.7 191.10 191 190 187 187
9 Liam Folk 11 Heritage 08:55.78 14:54.8 190.73 191 176 174 174 172 181 178 180
10 Oliver Zimmerman 10 Bothell (Cedar Park Christian School) 08:56.36 14:55.7 190.43 190 189 183 175 180
11 Logan Rohatinsky 11 Maple Mountain 08:56.85 14:56.5 190.17 190 190 190 184 185 181 183 180
12 Anthony Sarro 12 Gonzaga College 08:57.11 14:57.0 190.00 190 186 186 188
1 Benjamin Olds 10 Palmer Ridge 08:57.42 14:57.5 189.83 190 188 178 170 168 170 170
13 Wyatt Carr 11 Coeur d'Alene 08:57.51 14:57.6 189.80 190 164 190 187 182 181
14 Jaxon Northcutt 11 Mt. Carmel (SD) 08:57.71 14:58.0 189.67 190 178 186 177 184 183
1 Andres Lomeli 12 Kimball (John C) (SJ) 08:58.02 14:58.5 189.50 190 185 189 187 183 187 187 181 188
15 Jeff Hazard 11 Northridge 08:58.11 14:58.6 189.47 189 179 181 181 180 176 173
16 Alfonso Del Toro 12 Matilda Torres (CS) 08:58.20 14:58.8 189.40 189 176 176 168 175 167 166 173 170
17 Jamie Chandler 12 Deerfield 08:58.37 14:59.1 189.30 189 177 180
1 Quenton Lanese 9 Olympia 08:58.76 14:59.7 189.10 189 182 187 178 175
2 Reynolds Young 11 Christ School 08:58.98 15:00.1 188.97 189 185 178 179 177 182 176 174
18 Michael Scarince 11 South Pasadena (SS) 08:59.27 15:00.6 188.80 189 187 181 175 178 172
19 Symond Martin 12 Page 08:59.28 15:00.6 188.80 189 183 191 182 188 182 184
3 Kiefer Willcox 12 Tahoe Truckee (NIAA) 08:59.37 15:00.7 188.77 189 182 183 180 182 186 176
2 Grant Hejny 12 American Fork 08:59.59 15:01.1 188.63 189 172 170 183 174 171 174 169 162 174
20 Wells Peterson 12 TMI Episcopal 08:59.61 15:01.1 188.63 189 172 181
4 Lyle Mideiros 12 Claremont (SS) 09:00.20 15:02.1 188.30 188 185 188 186 181 176 171
21 Gabriel Voelker 12 Raymore-Peculiar 09:00.33 15:02.4 188.20 188 184 186 188 176 186
2 Ethan Hansen 11 Century 09:00.85 15:03.2 187.93 188 169 180 181
3 Teddy Hojlo 11 Brunswick School 09:00.88 15:03.3 187.90 188 173 186 181 181 189 181
4 Peter Kendall 12 Twelve Bridges (SJ) 09:01.06 15:03.6 187.80 188 183 182
5 John Boland 11 San Antonio Antonian 09:01.19 15:03.8 187.73 188 182 177 181 180
5 Alijah Murillo 12 Branham (CC) 09:01.55 15:04.4 187.53 188 185 190 182 186
22 Carson Smith 12 Air Academy 09:01.68 15:04.6 187.47 187 184 184 185 186 184 181 182
6 Michael Ortega 12 Ontario (SS) 09:01.79 15:04.8 187.40 187 162 182 183 180 184 178 176
6 Samuel Hill 11 St. Charles (North) 09:02.04 15:05.2 187.27 187 186 183 176
7 Cam Kuss 11 Broughton 09:02.39 15:05.8 187.07 187 161 182 173 172
1 Djali De Chalus 11 St. Mary's College HS (NC) 09:02.44 15:05.9 187.03 187 180 175 166
23 Alan Gallardo-Lopez 12 Fayetteville 09:02.51 15:06.0 187.00 187 182 184 174 184
8 Dallin Harrington 12 American Fork 09:02.61 15:06.2 186.93 187 177 177 175 179 171 175 173 171 163
2 Eli Jarvis 12 Herriman 09:02.64 15:06.2 186.93 187 188 186 183 180 187 181 184 173
9 Matthew Lawrence 12 Mercer Island 09:02.67 15:06.3 186.90 187 189 182 177 173 182 178
7 Nathan Wilber 12 Cathedral Catholic (SD) 09:02.74 15:06.4 186.87 187 182 171 177 180 179
10 Wyatt Falkowski 12 Christian Brothers Academy 09:02.99 15:06.8 186.73 187 184 185 180 179 176
8 Danny Kuran 11 Union Catholic Reg. HS 09:03.48 15:07.6 186.47 186 180 178 179 178 170 178 168
11 Elias Thronson 10 Davis (SJ) 09:04.14 15:08.7 186.10 186 168 177 189
12 Sean Giles 11 Fort Collins 09:04.36 15:09.1 185.97 186 177 186 173 179 176 165
3 Alex Bland 12 Flagstaff 09:04.42 15:09.2 185.93 186 184 179 181 183 181
13 Carson Stafford 10 Tahoma Senior 09:04.85 15:09.9 185.70 186 162 178 174 170
4 Billy Romero 11 Taos 09:05.10 15:10.3 185.57 186 177 172 178 182 176
14 Calvin Rivera 11 Centennial High 09:05.36 15:10.8 185.40 185 171 175 173 176
5 Maseco Colombant 10 Reno 09:05.44 15:10.9 185.37 185 154 175 175
9 Christian Weber 12 Arnold O. Beckman (SS) 09:05.56 15:11.1 185.30 185 174 169 176 170 166
10 Dallas Reeves 11 Christ School 09:05.72 15:11.4 185.20 185 175 182 182 177 167 178 167
15 Benjamin Fernandez 12 Matilda Torres (CS) 09:05.95 15:11.7 185.10 185 186 182 179 184 177 179 183 178
6 Gunner Silva 12 Classical Academy (SD) 09:06.04 15:11.9 185.03 185 183 179 179
7 Micah Newkirk 12 Valley Christian 09:06.09 15:12.0 185.00 185 171 176 176 174
3 Noah Thompson 12 Lewis-Palmer 09:06.29 15:12.3 184.90 185 175 178 179 174 177 156 174 174
8 Luke Lopez 12 Roosevelt (SS) 09:06.35 15:12.4 184.87 185 183 179 177 177 178
24 Henry Herb 11 Seattle Preparatory School 09:06.49 15:12.6 184.80 185 177 170 179 177
4 Brady Lukasiewicz 10 Jesuit 09:06.92 15:13.4 184.53 185 174 179 173 166 166
16 Ellery Shutt 12 Woodstock (H.S) 09:07.16 15:13.8 184.40 184 170 176 161 171
11 Viggo Bortolin 11 Foothill Technology (SS) 09:07.40 15:14.2 184.27 184 181 180 169 173
12 Dylan Mehnert 12 West Torrance (SS) 09:07.79 15:14.8 184.07 184 174 180 179 179 176 172
25 Noel Huato 12 Del Oro (SJ) 09:07.86 15:14.9 184.03 184 166 187
17 Sawyer Hutton 10 Somerset Academy Sky Pointe 09:07.92 15:15.0 184.00 184 168 170 178 177 169 167
18 William Van Tress 12 Herriman 09:07.99 15:15.1 183.97 184 170 159 177 178 165 172 163 161 170 170 153
13 Braulio Castillo 12 West Ranch (SS) 09:08.55 15:16.1 183.63 184 171 188 182 180 175 172 176 172
19 Ryan Collins 12 Christian Brothers Academy 09:08.57 15:16.1 183.63 184 180 184 181 181 176 179 179
9 Landon Warriner 11 McClatchy (C.K.) (SJ) 09:08.65 15:16.2 183.60 184 180 173 177 175 171
26 Caden Bybee 11 Lone Peak 09:08.88 15:16.6 183.47 183 182 188 183 181 175 175 179 169
14 Champ Ransom 12 Natrona County 09:08.90 15:16.7 183.43 183 176 166 174
10 Inban Kathiravan 12 Woodbridge (SS) 09:09.03 15:16.9 183.37 183 181 165 171 170 168
11 Caleb Brown 12 Herriman 09:09.31 15:17.3 183.23 183 141 145
5 Judah Daffron 12 Taos 09:09.36 15:17.4 183.20 183 176 175 181 171
15 Charles Abemayor 12 Harvard Westlake (SS) 09:09.40 15:17.5 183.17 183 181 182 174
30 Will Fadden 12 Thomas Jefferson S&T 09:09.53 15:17.7 183.10 183 177
12 Bodie Thomas 12 Mercer Island 09:09.70 15:18.0 183.00 183 185 183 171 172 180 181
13 Miles Braithwaite 12 Lehi 09:09.91 15:18.3 182.90 183 181 186 183 184 184 185 185 185 180
14 Brendan Reardon 12 Marquette 09:10.18 15:18.8 182.73 183 184 184 182 173
15 Alejandro Casaus 11 Rio Rancho 09:10.65 15:19.6 182.47 182 184 181 166 172 178
20 Blake Bay 11 Fresno Christian (CS) 09:10.82 15:19.9 182.37 182 192 190 187 174 190 186 179
6 Noah Clancy 12 Christ School 09:10.95 15:20.1 182.30 182 166 171 178 177 159 172 164
21 Liam Luff 12 Trinity School 09:11.00 15:20.2 182.27 182 163 172 174 165 163
7 Liam Donnelly 12 Jesuit 09:11.23 15:20.6 182.13 182 166 177 178 168 169 168
8 Jackson Mathews 11 Desert Hills 09:11.71 15:21.4 181.87 182 169 169 164 170 173
9 David Williams 12 Seton Catholic 09:11.77 15:21.5 181.83 182 175 175
31 Ayuub Hassan 11 Northfield 09:11.77 15:21.5 181.83 182 184 162 181 172 179
16 Amilo Rajandram 11 Chicago (Whitney Young) 09:12.23 15:22.2 181.60 182 176 180 174
16 Jackson Levasseur 12 Christian Brothers (SJ) 09:12.87 15:23.3 181.23 181 175 181 167 175
10 Thomas Capelli 12 Oak Ridge (SJ) 09:13.15 15:23.8 181.07 181 172 173 172 170
22 Phil Contakes 12 Dos Pueblos (SS) 09:13.17 15:23.8 181.07 181 175 177 175 161 167
11 Ramsey Hansen 12 NEST+m 09:13.37 15:24.1 180.97 181 167 150 167 161 150 160 156
27 Armando Cruz 11 Belen Jesuit Preparatory School 09:13.46 15:24.3 180.90 181 185 189 185 188 183 181 182
28 Matyas Bird 12 Westlake 09:13.65 15:24.6 180.80 181 174 173 177 179 181 183 181
23 Elijah Medina 10 Redlands East Valley (SS) 09:13.71 15:24.7 180.77 181 172 166
24 Jackson Farmer 12 Reagan 09:14.45 15:25.9 180.37 180 172 168 178 177 168 181 168
12 Marcus Napoli 11 Nipomo (CS) 09:14.68 15:26.3 180.23 180 172 170
13 Ryan Wilensky 11 Bullis School 09:14.73 15:26.4 180.20 180 158 165
14 Cameron Povletich 11 West Ranch (SS) 09:14.85 15:26.6 180.13 180 171 166 161 165 157 156
25 Dorian Bening 12 Agoura (SS) 09:14.91 15:26.7 180.10 180 173 179 183 180
17 Owen Hintz 12 Bismarck 09:15.05 15:26.9 180.03 180 169 185 180 180 171
15 Tucker Presnell 12 St. Mary's College HS (NC) 09:15.17 15:27.1 179.97 180 175 168 172
18 Hassan Syed 11 Arnold O. Beckman (SS) 09:15.56 15:27.8 179.73 180 172 172 170 165
16 Jack Grossen 11 Skyridge 09:15.89 15:28.3 179.57 180 175 173 172 179 173 176 171 159 165
29 Carson Ehman 12 Mira Costa (SS) 09:16.39 15:29.2 179.27 179 172 184 177 181 182 179 177
17 Ty Hundley 11 Vacaville (SJ) 09:16.54 15:29.4 179.20 179 160 177 181 177 170 177
18 Ian Greene 12 Skyridge 09:17.18 15:30.5 178.83 179 179 176 176 176 171 167 171 169 165
19 David Oman 11 Riverton 09:17.23 15:30.6 178.80 179 177 179 172 178 169 169
20 Jackson Horvath 8 Santiago Corona (SS) 09:17.35 15:30.8 178.73 179 166 163
30 Evan Dann 10 Castle View 09:17.79 15:31.5 178.50 179 174 182 176 174 174
21 Hunter Horrocks 12 Union 09:18.38 15:32.5 178.17 178 174 160 173 165 155 166 163
26 Porter Spiceland 12 Memphis University School 09:19.43 15:34.2 177.60 178 172 179 176 161 156
22 Miles Miller 11 Hellgate 09:19.46 15:34.3 177.57 178 179 174 174 173
23 Emerson Hamma 12 Charles M. Russell 09:19.88 15:35.0 177.33 177 170 170
19 Kurt Perry 10 Riverton 09:20.47 15:36.0 177.00 177 174 176 180 176 168 169 161
24 Daniel Cheyer 12 Branham (CC) 09:20.79 15:36.5 176.83 177 169 178 174 175
27 Ryan Fitzpatrick 12 The Nueva School (CC) 09:21.39 15:37.5 176.50 177 183 182 185 180
31 Preston Spangler 11 Patriot 09:21.43 15:37.6 176.47 176 178 182 177 176 178
28 Carson Kaiser 10 Maple Park (Kaneland) 09:21.49 15:37.7 176.43 176 188 191 186 182
20 Brady Bertsch 12 Glendora (SS) 09:22.13 15:38.8 176.07 176 176 163
17 Ammon Bitton 11 Century 09:22.56 15:39.5 175.83 176 178 172 168
18 Parker Harris 10 Layton 09:22.57 15:39.5 175.83 176 171 176 170 173 176 169 167
21 Ayden Ramirez 11 Cajon (SS) 09:22.94 15:40.1 175.63 176 176 169 169
25 Luis Torres Orrala 12 Valencia (SS) 09:23.74 15:41.4 175.20 175 177 176 169 163
22 Elliot Hickey 12 ABQ Academy 09:24.64 15:42.9 174.70 175 170 139 159
23 Nathaniel Bartunek 12 Castle View 09:25.00 15:43.5 174.50 175 177 178 177 177 175 163
26 Toren Habbestad 12 Yorba Linda (SS) 09:25.51 15:44.4 174.20 174 178 175 177 167
24 Dylan Shugg 12 South Pasadena (SS) 09:25.56 15:44.5 174.17 174 174 171 170 169 167
19 Collin Foley 12 Mountain Ridge 09:25.62 15:44.6 174.13 174 175 169 166 171 176
25 Sam Hurst 12 Los Altos (CC) 09:26.02 15:45.3 173.90 174 158 176 171
27 Wyatt Morgenstern 10 Coeur d'Alene 09:26.26 15:45.7 173.77 174 177 157 181 183 181 185 172
26 Hayes Terry 12 Beyer (Fred C.) (SJ) 09:26.65 15:46.3 173.57 174 171 167 168
28 Josiah Himsl 11 Hart (William S.) (SS) 09:26.91 15:46.7 173.43 173 177 174 179 170 165
32 Elliot Stout 12 Taylorsville 09:27.79 15:48.2 172.93 173 177 167
27 Dylan Escorcia 11 Arapahoe 09:28.87 15:50.0 172.33 172 163 161 155 165 169 162
20 Carter Prater 12 Somerset Academy Sky Pointe 09:29.12 15:50.4 172.20 172 166 182 186 188
32 Lucas Santos 10 Valor Christian 09:29.22 15:50.6 172.13 172 177 179 179 178 178 172 177
28 Ryan Chen 12 Mountain View (CC) 09:29.77 15:51.5 171.83 172 181 177 185 174 180 179
29 Kai Tilley 12 South Pasadena (SS) 09:30.75 15:53.2 171.27 171 166 170 159 165 158
21 Takashi Shipp 12 Orem 09:31.78 15:54.9 170.70 171 172 175 173 170 176 177 175 173 167
29 Connor Bilodeau 11 Jesuit (SJ) 09:32.39 15:55.9 170.37 170 174 181 175 183 186
30 Milo Kauffman 11 Helena 09:33.75 15:58.2 169.60 170 186 176 173 171
31 Oren Hill 12 Thousand Oaks (SS) 09:33.89 15:58.4 169.53 170 170 179
30 Matthew Wroblewski 11 Jesuit 09:34.09 15:58.7 169.43 169 172 170 174 179 174 174
32 Nathaniel Laursen 12 Issaquah 09:37.27 16:04.0 167.67 168 171 164 169 166 170 169
31 Thomas Isenovski 12 Saratoga Springs 09:37.71 16:04.8 167.40 167 178 185 187 185 187 188 189 174 184
22 Tyson Gubler 12 Riverton 09:38.34 16:05.8 167.07 167 175 166 176 171 173
32 Ewan Conroy 12 Bullis School 09:41.97 16:11.9 165.03 165 150 165
33 Kennan Byers 12 Randolph HS 09:42.59 16:12.9 164.70 165 179 182 170
29 Arnav Agrawal 11 Milpitas (CC) 09:56.57 16:36.3 156.90 157 177 170 178 175
33 Kole Steele 12 Galena 09:57.04 16:37.1 156.63 157 160 159 157 163
23 Owen Mangrum 12 Curtis Senior 10:07.74 16:54.9 150.70 151 169 165 168 157 175
|
| GIRLS Combined 3200 Meter Track Races - Estimated Speed Ratings |
Girls Merged 3200 Meters Actual
3200m Estimated Estimated 2025 XC Season Speed Ratings
Pl Name Gr School Time 5K Time Speed Rating (sequential order - most recent first)
================================================================== -------- -------- ------------ ----------------------------------------
1 Abigail Hennessy 12 Westford Academy 09:50.84 16:26.7 160.10 160 160 158 151 152 148
2 Ruby Ihmels 11 Century 09:59.06 16:40.4 155.53 156 141 148 149 152
3 Gabbie Bishop 12 Providence Academy 09:59.64 16:41.4 155.20 155 143 145 143
4 Sundara Weber 12 Sandwich 10:00.10 16:42.2 154.93 155 154 152 152 144 147
5 Addison Ritzenhein 12 Niwot 10:00.13 16:42.2 154.93 155 145 149 151 155 143 145 118
6 Emry Schwalm 12 Heritage 10:01.56 16:44.6 154.13 154 153 148 128 140 144 147 142 148
7 Amaya Bharadwaj 12 Palo Alto (CC) 10:01.93 16:45.2 153.93 154 150 149 141 148
8 Hadassah Beshears 10 Har-Ber 10:02.84 16:46.7 153.43 153 138 133 133
9 Calysta Garmer 12 Webb School of Knoxville 10:03.08 16:47.1 153.30 153 146 149 149 151 149 151 150 150 146
10 Jazzlyn Garmer 12 Webb School of Knoxville 10:03.23 16:47.4 153.20 153 152 147 146 143 141 151 150 150 145
11 Julia Kelly 10 Downingtown West 01 10:04.99 16:50.3 152.23 152 150 147 132 136 134 134
12 Delaney Reuter 11 Eaton 10:06.01 16:52.0 151.67 152 156 151 140 147 144 146
13 Lilly Beshears 12 Rogers 10:10.39 16:59.4 149.20 149 142 147 143 144
14 Ellie Maddox 12 Sioux Falls Christian 10:11.48 17:01.2 148.60 149 136 147 137 133 141 146
15 Elise Hagen 11 Niwot 10:13.25 17:04.1 147.63 148 126 124 121 109 118
16 Hallie Heemeyer 12 Rocky Mountain 10:13.81 17:05.1 147.30 147 137 149 147 147 136 131
17 Payton Meineke 12 Riverdale Ridge 10:14.54 17:06.3 146.90 147 142 140 140 141 136
18 Addyson Guymon 12 Emery 10:15.25 17:07.5 146.50 147 111 122
19 Peyton VanDeest 11 Spearfish 10:15.93 17:08.6 146.13 146 152 140 121 122 142
20 Avery Barton 11 Ogden 10:16.47 17:09.5 145.83 146 138 142 139 131 140 133
21 Maya Bybee 11 Lone Peak 10:17.00 17:10.4 145.53 146 130 131 132 136 134 133 130
22 Caroline Fender 12 Heritage 10:18.60 17:13.1 144.63 145 133 130 131 132 131 134 135 133
23 Anna Salter 12 Crystal Springs Uplands School (CC) 10:18.99 17:13.7 144.43 144 133 127 127
24 Emily Cohen 12 Cherry Creek 10:20.09 17:15.6 143.80 144 146 125 148 137 143 139 138 136 125
25 Skye Jensen 11 American Fork 10:21.76 17:18.3 142.90 143 135 136 137 133 129 128 131 135 128
1 Elliana Patterson 11 Christian (SD) 10:22.44 17:19.5 142.50 143 139 142 141 144 139 124
26 Alina Gutierrez St. Francis (SJ) 10:23.70 17:21.6 141.80 142 no data
27 Claire Guiberson 12 Mountain Vista 10:23.83 17:21.8 141.73 142 135 139 134 137 142 143 145 137 138
28 Ariella Llorens 12 Francis Parker (SD) 10:23.88 17:21.9 141.70 142 136 139 132 136 125
29 Mary Nesmith 12 Marietta 10:24.98 17:23.7 141.10 141 120 131 131 121
2 Gioia Coudriet 10 Galena 10:27.28 17:27.6 139.80 140 143 142 133 135
3 Monserrat Santillan Silva 12 Century (SS) 10:27.36 17:27.7 139.77 140 127 133 132 124 124 112
4 Delaney Napierala 12 Oaks Christian (SS) 10:28.27 17:29.2 139.27 139 112 113 127
30 Isabella Ramirez 12 Bullard (CS) 10:28.70 17:29.9 139.03 139 138 139 137 135 125
5 Morgan Delaney 11 Polson 10:29.80 17:31.8 138.40 138 129 115 61
6 Brooke Oliveira 11 Castilleja School (CC) 10:30.75 17:33.4 137.87 138 116
31 Brynn Davenport 11 Crater 10:32.07 17:35.6 137.13 137 138 130 132 138
1 Norah Feldt 11 Davis (SJ) 10:32.46 17:36.2 136.93 137 111 115 117 129
7 McKenna Groen 9 Regis Jesuit 10:32.64 17:36.5 136.83 137 131 129 137 132 128 132
8 Scarlett Parks 11 Niwot 10:33.40 17:37.8 136.40 136 128 123 105 122 117 113
2 Millie Bayles 12 Trabuco Hills (SS) 10:36.68 17:43.3 134.57 135 144 147 142 139 140 134
32 Charlotte Hopkins 12 Arcadia (SS) 10:36.93 17:43.7 134.43 134 135 132 135 140
3 Dakota Saenz 10 Berkeley (NC) 10:36.97 17:43.7 134.43 134 122 123
9 Taryn Coulston 11 Santa Margarita (SS) 10:37.16 17:44.1 134.30 134 132 133 110 114 118 117
4 Bridget Smit 10 Brighton 10:37.71 17:45.0 134.00 134 120 138 138 126 123 131 137 128 122
5 Ella Solorzano 12 Union Catholic Reg. HS 10:38.23 17:45.8 133.73 134 118 96 105 122 116 118 123
6 Brenna Mannion 12 Vista del Lago (SJ) 10:38.60 17:46.5 133.50 134 136 135 132 128
1 Lindsey Billotte 10 Classical Academy (SD) 10:38.94 17:47.0 133.33 133 138 117 126
33 Chamorra Cooper 11 Air Academy 10:39.97 17:48.7 132.77 133 131 130 138 140 137 137 128
10 Jetta Betts 11 ThunderRidge 10:40.38 17:49.4 132.53 133 123 121 125 115 120 126 113 97
2 Mariah Galbraith 10 Rio Rancho 10:41.02 17:50.5 132.17 132 123 116 120 115 120
7 Ayanna Hickey 12 Bishop's School (SD) 10:41.02 17:50.5 132.17 132 127 128 125 134
11 Maeve Vancik 10 Arapahoe 10:41.28 17:50.9 132.03 132 120 129 134 128 132 121 121
8 Nadya Makarova 10 Monte Vista (NC) 10:41.55 17:51.4 131.87 132 111 126 121 112 113 105
9 Jia Rhee 10 Harvard Westlake (SS) 10:41.89 17:52.0 131.67 132 114 124 118 120
12 Taylor Drewry 12 Basha 10:42.38 17:52.8 131.40 131 133 140 136 128 133
3 Gelila Hailu 11 Leigh (CC) 10:42.66 17:53.2 131.27 131 122 132 126 132
13 Isabel Gladden 9 Sage Creek (SD) 10:43.10 17:54.0 131.00 131 133 121 114 124 121 117
4 Kyla Meissner 11 Broadwater 10:44.18 17:55.8 130.40 130 108 103
14 Isabella Ruiz 11 Ontario (SS) 10:44.25 17:55.9 130.37 130 103 118 126 115 118
15 Carina Nottingham 12 Berkeley (NC) 10:44.49 17:56.3 130.23 130 129 120 122 124
5 Aislin McMahon 11 Somerset Academy Sky Pointe 10:44.56 17:56.4 130.20 130 126 120 123
6 Riley Biddle 11 Rancho Bernardo (SD) 10:44.62 17:56.5 130.17 130 no data
7 Audra Huempfner 12 Highland High 10:44.72 17:56.7 130.10 130 122 128 118
8 Middleton Sydney 12 Redwood (NC) 10:45.12 17:57.4 129.87 130 132 129 132 118 119
16 Calia Vaughn 10 Boulder 10:45.44 17:57.9 129.70 130 132 132 123 128 134 132
9 Kelly McIntire 11 Point Loma (SD) 10:45.81 17:58.5 129.50 130 127 120 94
10 Brianne Duynstee 12 La Costa Canyon (SD) 10:46.03 17:58.9 129.37 129 124 117
17 Maggie De la Rionda 12 Thousand Oaks (SS) 10:46.05 17:58.9 129.37 129 122 104
18 Summer Muxlow 10 North Hall 10:46.36 17:59.4 129.20 129 122 120 129 119
19 Brenna Jorde 12 Mountain Vista 10:46.43 17:59.5 129.17 129 118 115 106 111 109 110 118 109 107
20 Shelby Taylor 11 Morro Bay (CS) 10:46.99 18:00.5 128.83 129 no data
11 Mia Ritter 11 Mira Costa (SS) 10:47.40 18:01.2 128.60 129 117 129 124 124 117 112 118
10 Kira Dye 12 Crystal Springs Uplands School (CC) 10:47.58 18:01.5 128.50 129 126 116 104 109
21 Nadia Mejia 12 Wilson - Long Beach (SS) 10:48.08 18:02.3 128.23 128 127 126 120 128 122 116
34 Natalie Arriaza 12 Patterson 10:48.25 18:02.6 128.13 128 130 135 121 135
22 Kylee Hu 11 Cherry Creek 10:48.75 18:03.4 127.87 128 126 119 129 135 130 126 118
23 Anna Villavicencio 12 Woodlake (CS) 10:48.81 18:03.5 127.83 128 118 129 114 120 128
12 Emelyn Angelo 11 Ponderosa (SJ) 10:49.09 18:04.0 127.67 128 129 123 118
11 Emily Bellinger 11 California (NC) 10:49.18 18:04.1 127.63 128 124 120 126
24 Leah Larson 12 Riverton 10:49.66 18:04.9 127.37 127 112 115 111 105 105 98
13 Stella Junius 12 Mt. Carmel 10:49.91 18:05.3 127.23 127 112 130 131 122 117
12 Camila Treviño-Davila 10 Claremont (SS) 10:49.99 18:05.5 127.17 127 129 121 113 125 121 111
13 Sade Bumpus 11 Granada (NC) 10:50.01 18:05.5 127.17 127 129 126 128 121
14 Adriana Ingargiola 12 Oak Ridge (SJ) 10:50.25 18:05.9 127.03 127 121 117 129 120
15 Jenna Murray 11 Moorpark (SS) 10:50.30 18:06.0 127.00 127 123 126 123 118
25 Sabina Cruz 9 Westlake (SS) 10:50.33 18:06.1 126.97 127 134 128 132
16 Eleanor Hampton 10 Merced (SJ) 10:51.82 18:08.5 126.17 126 121 122
14 Reese Tamburro 12 Agoura (SS) 10:54.12 18:12.4 124.87 125 120
26 Adria Favero 11 Olympus 10:54.60 18:13.2 124.60 125 113 121 116 126 122 116 114 102
15 Isabella Cropper 11 Pinnacle 10:54.88 18:13.6 124.47 124 90 111
27 Annika Mark 12 Saugus (SS) 10:55.33 18:14.4 124.20 124 123 118 117 116 104 120
17 Teagan Harris 10 Lone Peak 10:55.95 18:15.4 123.87 124 122 119 117 111 115 111
16 Phoebe Maixner 9 Bozeman 10:56.82 18:16.9 123.37 123 133 125 117 120 117
17 Makayla Galvan 12 Vacaville (SJ) 10:57.28 18:17.7 123.10 123 134 119 118 118 100
18 Olivia Bollenbach 12 Polytechnic - Riverside (SS) 10:57.74 18:18.4 122.87 123 126 127 124 118 122 118
19 Eva Soto 11 Whitney (SJ) 10:57.79 18:18.5 122.83 123 127 119 122
28 Maya Parker 12 Westlake 10:58.59 18:19.8 122.40 122 117 111 106 102 115 110
29 Alyssa Trevino 11 Marietta 10:58.70 18:20.0 122.33 122 125 118 116 120
30 Sasha Dehal 11 Ecole Panorama Ridge 10:59.71 18:21.7 121.77 122 120 129 134
20 Emerson McMeekin 12 Ventura (SS) 10:59.81 18:21.9 121.70 122 121 115 52 58
21 Elle Kirman 11 Harvard Westlake (SS) 11:00.06 18:22.3 121.57 122 122 118 112
22 Sydney Rubio 11 Huntington Beach (SS) 11:00.34 18:22.8 121.40 121 85 131 125 124
23 Brooklyn Tarr 12 Mountain Ridge 11:02.23 18:25.9 120.37 120 119 108 121 116 120 118 111 114 118
18 Alahna Thomas 12 Santa Margarita (SS) 11:02.30 18:26.0 120.33 120 122 124 126 121 131
31 Zoe Corder 12 Bella Vista (SJ) 11:02.66 18:26.6 120.13 120 124 118 118 123
32 Alyssa Clayton 11 Viewmont 11:02.85 18:27.0 120.00 120 115 110 113 112 119 106
19 Harper Telesca 9 Union Catholic Reg. HS 11:03.29 18:27.7 119.77 120 131 142 140 129 125 129 127
24 Kozubik Kate 11 Redwood (NC) 11:03.34 18:27.8 119.73 120 108 95 125 115 116
33 Kaylie O'Connell 10 Monte Vista (NC) 11:04.91 18:30.4 118.87 119 109 118 132 126 124 126
34 Amber Dazey 12 Tesoro (SS) 11:07.00 18:33.9 117.70 118 124 115 121 122 111 118
20 Allie Harman 12 Rocklin (SJ) 11:08.42 18:36.3 116.90 117 94 116
25 Aine Pitillo 9 Oak Park (SS) 11:08.59 18:36.5 116.83 117 118
26 Elise Corr 10 Seattle Preparatory School 11:08.91 18:37.1 116.63 117 131 119 123 126 121
27 Ellie Schoenfeld 9 Air Academy 11:09.42 18:37.9 116.37 116 91 104 107 106 91 85 85
35 Becky Osorio 12 West Covina (SS) 11:10.52 18:39.8 115.73 116 130 128 123 128 124
36 Grace Swanson 12 Riverton 11:10.78 18:40.2 115.60 116 124 115 120 113 118 113
28 Madeline Goss 10 Woodcreek (SJ) 11:11.34 18:41.1 115.30 115 131 120 120
29 Kylee Neil 11 Bozeman 11:16.50 18:49.8 112.40 112 119 114 112 120 122
30 Audrey O'Connor 12 Basha 11:17.66 18:51.7 111.77 112 112 120 115
37 Sophie Hutchinson 12 Whitney (SJ) 11:20.42 18:56.3 110.23 110 132 124 134
21 Emilia Gonzalez 12 Arcadia (SS) 11:27.27 19:07.7 106.43 106 102 116 107
22 Jane Landon 12 Whitney (SJ) 11:27.63 19:08.3 106.23 106 124 98 113
23 Lilah Enyedi 12 Del Norte (SD) 11:28.22 19:09.3 105.90 106 98 99 101 96
24 Elizabeth Jacklin 11 ML King (SS) 11:34.46 19:19.7 102.43 102 109 130 133 128 138 135 132 115
|
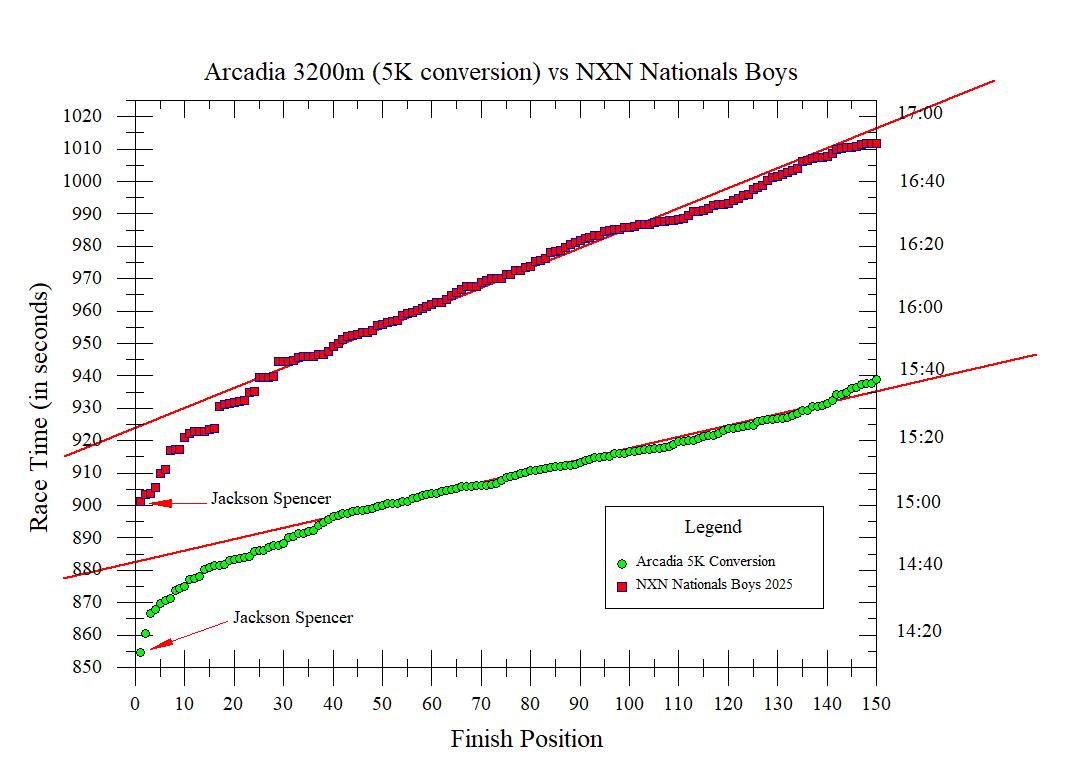
Graph for BOYS Arcadia Track Invitational 2026 vs NXN National Race 2025
This graph depicts the correlation between the Boys 3200m runners at the Arcadia Invite 2026 and at NXN Nationals 2025. There were 182 runners at Arcadia and 200 at NXN Nationals ... close enough number-wise so no graph scaling was necessary ... the graph shows only the top 150 runners (I typically exclude the slower runners in practice anyways).
The graph illustrates the noticeable difference in speed between the 5K conversions at Arcadia versus the 5K times at NXN Nationals ... This is, of course, expected ... Running on a track under great conditions should be much faster than running on a soft XC course ... The question becomes "How much faster??".
Looking at the graph and knowing about common
runners at both races, an assumption of somewhat similar "quality" in both races
seemed possible ... The straight red lines drawn through both data sets was
fairly easy to place for these races ... Sometimes the lines need to be drawn a
bit differently depending on the race and quality of sections of the race - This
annoys some statisticians who want to take all the data points and derive a
straight line stat fit which can often yield "a less than accurate fit for the
intended purpose" ... As I have noted elsewhere, my process is part math and
part experience - I don't like losing money when betting on imperfect data
points like humans and horses![]() .
.
The slope of NXN National race is higher than the Arcadia Invite conversions ... This is expected and normal for similar quality when one race is much faster than the other ... In this situation and most XC races I speed-rate, the difference in speed rating speed is ALWAYS determined by the time difference at the left Y-axis (when similar quality is assumed).
My speed rating correction for the Boys NXN race was minus 51 seconds (meaning I added 51 seconds to all boy's times to calculate the final speed ratings.
The straight red lines on the graph can typically be moved up or down somewhat ... For the NXN vs. Arcadia races on the graph, I felt a range between 39 and 48 seconds difference at the Y-axis was OK enough ... the graph below shows 42 seconds faster ... So adding 42 seconds to the known NXN correction of 51 seconds yields a speed rating correction of minus 93 seconds (which is in the range of Woodward Park typical corrections).
Interestingly, the 93 second correction fell within my fitting of the sequential XC speed rating method noted above (consideration of the PR times at Arcadia was also considered) ... So the speed ratings for Arcadia posted above use 93 seconds for both the boys and girls ... The girls were derived separately and also found the 93 second correction.