Miscellaneous - XC 2003 (by TullyRunners.com)
| Is Van Cortlandt Park faster in 2003 Than 2002 ?? |
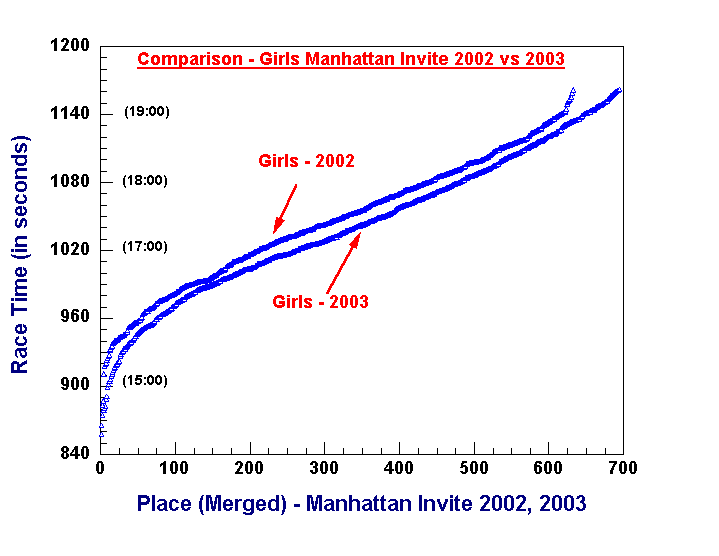
| The answer is YES ... The graph below is just one piece of the evidence, but it shows the difference very nicely ... The graph below also illustrates the foundation of my approach to determining how fast or how slow one cross country race is compared to another. Always, my first step in determining the speed of a race is to graph the race (race time versus place) whenever possible ... graphing requires a reasonable depth to results and a reasonable number of runners ... Complete results from large invitational races and sectionals are incredibly important to my methodology. One point needs to be emphasized (especially to the coaches and others who believe that the speed determinations by TullyRunners.com are just the opinion of one person (at best) who occasionally fudges the numbers for his own benefit) ... That graph below IS NOT MY OPINION - anybody can produced exactly the same graph by going to ArmoryTrack, collecting all the varsity results for the girl's races in 2002 and 2003, and then plotting the results ... Likewise, anybody can perform precisely the same steps with the sectional championship races for a really good comparison of the sectional races. Only one assumption is required for direct comparison of two races on the same graph - that the ability of the "mid-level" (average) runners in one race is approximately equal to the same group in the other race ... On these types of graphs, the "elite" and "above average" runners are designated by the curved part of the line ... the "mid-level" group starts where the line begins to straighten and is usually the biggest group of runners in a race (just like "C" students are the biggest group in school) ... I usually ignore the elite and most above average runners on these graphs and focus on the mid-level runners ... In any large race with small, medium and large schools and good, mediocre and below-average teams, the "mid-level" runners are approximately equal from race to race, section to section, and state to state (they don't have to be exactly equal ... Yes, it can be demonstrated) ... One point - the elite and above-average groups of runners have been growing recently as a percentage of runners in NY (that's great). Now back to the graph below ... Was the overall quality of the varsity girl runners at the Manhattan Invite (nearly 700 runners deep) about the same in 2002 and 2003?? ... the answer is easily Yes (a good diverse group for statistical evaluation) ... Therefore, just examine the graph and measure the time difference between the two lines ... it mostly varies from about 10 to 16 seconds ... I used a 12 second difference for my speed ratings ... I don't consider that 12 second adjustment to be much an opinion ... anybody can read the graph a determine a similar adjustment - and the same holds true for any large invitational or sectional race. I could show a number of other Van Cortlandt Park examples for this year, but I don't have time ... In all honesty, I'm not happy Van Cortlandt Park is running faster this year because it makes more work for me ... Over the past few years, VCP has been remarkably consistent in its speed (good or bad weather) ... when I noticed the change, I had to actually start examining the races more closely (not all VCP races are large and diverse like Manhattan and a graphic solution is not possible at times).
|
 |